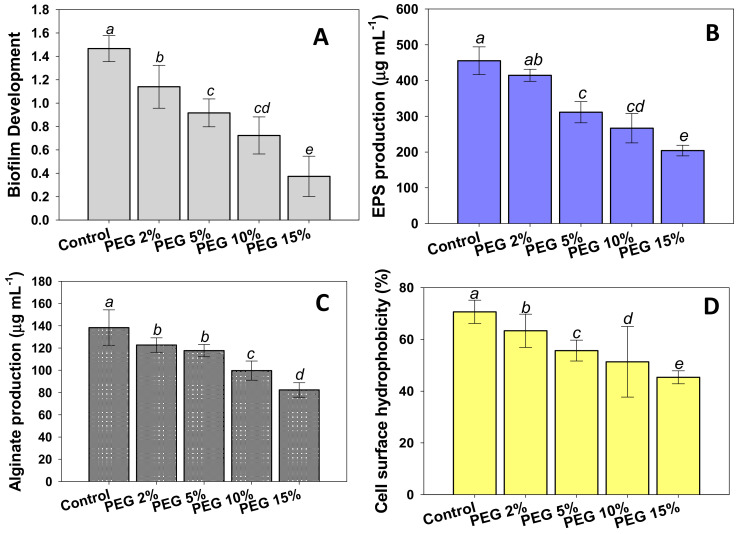
Figure 2.
Effects of different levels of water stress (2%, 5%, 10%, and 15% PEG solution) on biofilm development (A) and their associated traits; EPS production (B), alginate production (C), and cell surface hydrophobicity (D) of Enterobacter sp./L. adecarboxylata PAB 19. In these figures, bar diagrams represent the mean values of three replicates. Mean values followed by different letters were significantly different (p ≤ 0.05) as determined by the Duncan’s Multiple Range Test (DMRT). Bar and scatter plots represent means ± SDs.

