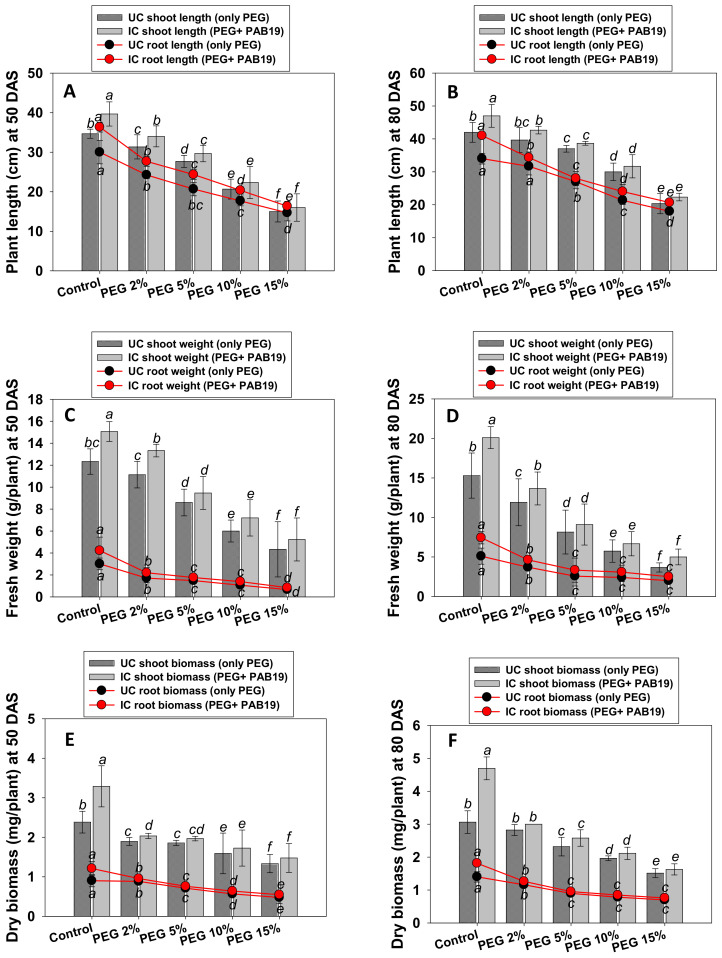
Figure 4.
Impact of the bio-inoculation of Enterobacter sp./L. adecarboxylata PAB19 on biological features; plant length at 50 DAS (A) and 80 DAS (B), fresh weight at 50 DAS (C) and 80 DAS (D), dry biomass at 50 DAS (E) and 80 DAS (F) of V. radiata (L.) cultivated under different levels of water stress (2%, 5%, 10% and 15% PEG-6000) under greenhouse conditions. Bar diagrams represent the mean values of three replicates. Mean values followed by different letters are significantly different (p ≤ 0.05) as determined by the DMRT. Bar and scatter plots represent means ± SDs.

