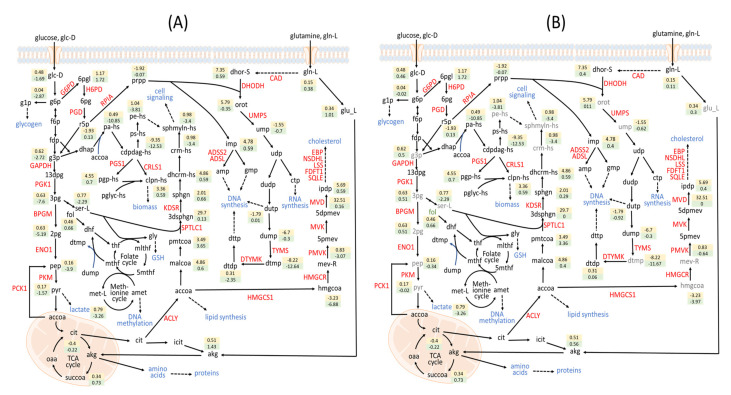
Figure 6.
Mean fold changes of metabolite-flows for perturbed cases and the template. The fold changes of metabolite-flows for the identified targets in (A) the first group and (B) the second group. The identified gene-encoding enzymes are represented in red. The identified antimetabolites are presented in gray. The values in yellow boxes denote fold changes of metabolite-flows for the template, whereas the green box displays for each perturbation. A positive value indicates that the metabolite-flow of cancer cells or the perturbation is higher than basal. A negative value represents lower flow.

