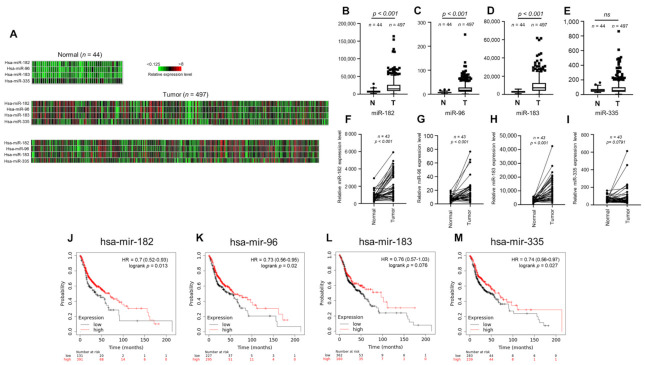
Figure 1.
Expression of the miR-182/96/183 cluster in HNSCC patients and survival analysis of patients stratified by miR-182/96/183 cluster expression. (A) Heatmaps of miR-182, miR-96, miR-183 and miR-335 expression in normal tissues and HNSCC tissues in the TCGA microRNA sequencing database (TCGA-HNSC). (B–E) Comparison of miR-182, miR-96, miR-183 and miR-335 expression in the TCGA-HNSC tumor and normal tissues. (F–I) The expression of miR-182, miR-96, miR-183, and miR-335 in 43 tumor tissues paired with corresponding adjacent normal tissues in the TCGA-HNSC dataset. (J–M) Comparison of overall survival in patients with high or low expressions of miR-182, miR-96, miR-183 and miR-335.

