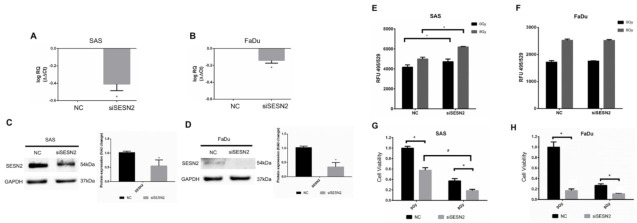
Figure 5.
Effects of SESN2 knockdown on ROS levels and HNSCC cell viability. (A,B) Quantification of SESN2 mRNA in SAS cells and FaDu cells transduced with SESN2 siRNA (siSESN2) by qPCR. (C,D) Detection of SESN2 protein expression in SAS cells and FaDu cells after transduction of siSESN2, respectively. The levels of SESN2 were normalized to GAPDH. *: p < 0.05. (E,F) Measurement of ROS levels in HNSCC cells with or without transduction of siSESN2. (G,H) Comparison of cell viability in SAS cells and FaDu cells with or without siSESN2 transduction using an MTT assay. *, #: p < 0.05.

