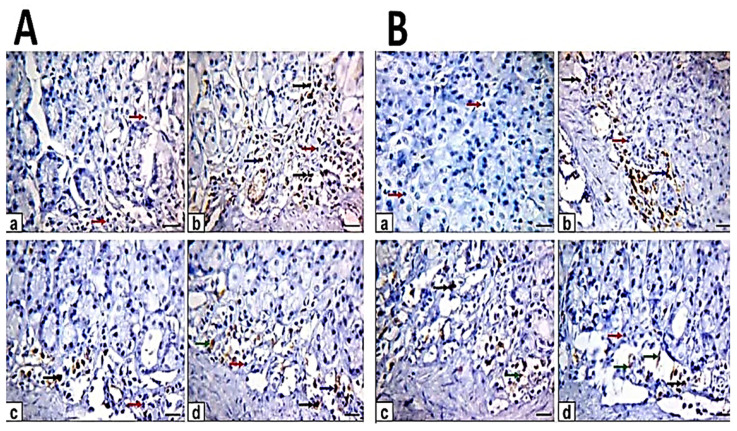
Figure 7.
Photomicrographs of immunohistochemical staining of tumor necrosis factor-alpha (TNF-α) protein expression in gastric section. Scale bar = 100 µm. (A) The gastric sections of the pretreatment group: (a) control rats, (b) ethanol-induced ulcer rats in one hour, (c) MO-pretreated (MO-EtOH) rats, (d) ME-pretreated (ME-EtOH) rats. Arrows in the panels are showing strong (black arrows), moderate (blue arrows), weak (green arrows), and negative (red arrows) brown immunoreactions. (B) The gastric sections of the treatment group: (a) control rats, (b) ethanol-induced ulcer rats on day 7, (c) MO-treated (EtOH-MO) rats, (d) ME-treated (EtOH-ME) rats. Arrows in the panels showed strong (black arrows), moderate (blue arrows), weak (green arrows), and negative (red arrows) brown immunoreactions.

