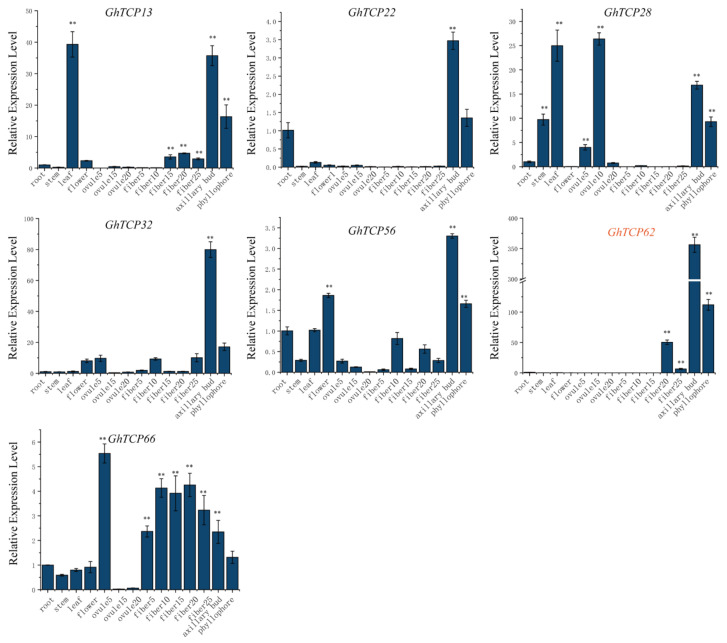
Figure 6.
Analysis of tissue-specific gene expression patterns in cotton including root, stem, leaf, flower, fibers and ovules in different stage, axillary bud, and phyllophore. The y-axis represents the expression level of GhTCP genes relative to the reference gene GhUBQ7. The error line represents the standard deviation of three repetitions. The asterisks indicated significant differences compared to root (** p < 0.01 by t-test).

