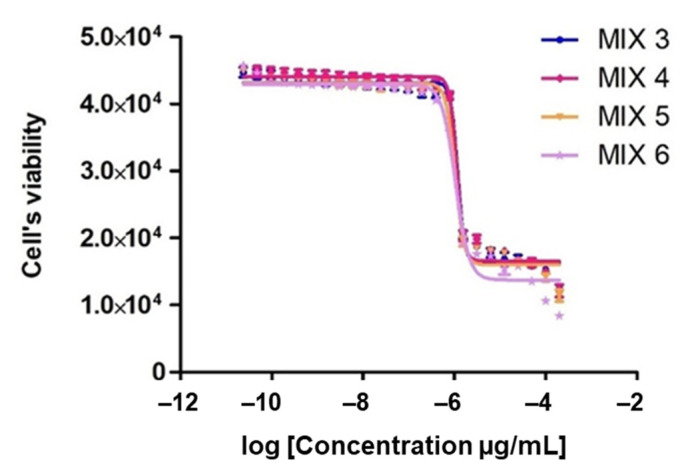
Figure 3.
Tests of combinations of EO constituents against T. brucei. The different mixes are described in Table 3 and the curves are colored according to the following scheme: Mix 3 (blue curve), Mix 4 (red curve), Mix 5 (orange curve), and Mix 6 (purple curve). Each EC50 value represents the mean of four independent experiments with standard errors.

