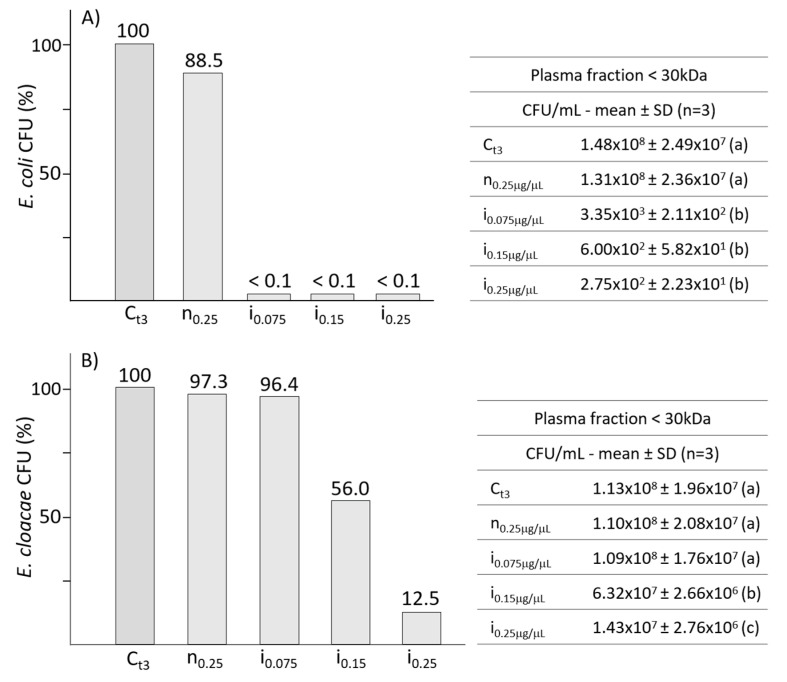
Figure 3.
Panels (A,B) show the effects of various concentrations of silkworm AMPs on E. coli and E. cloacae, respectively. Tables on the right present the bacterial growths expressed as CFU/mL. Different letters within brackets (a,b,c) indicate significant differences (p < 0.05, Tukey test). C: control; n: plasma from not infected larvae; i: plasma from infected larvae.

