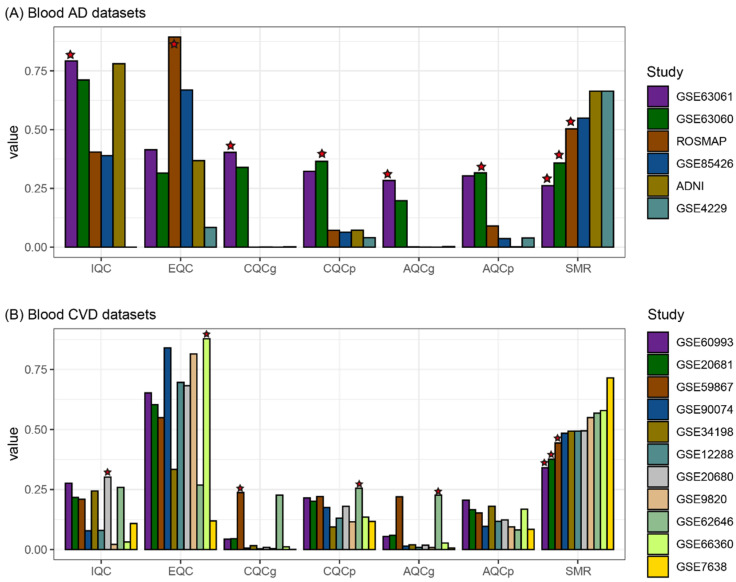
Figure 2.
Measurement and comparison of the quality of the blood gene expression datasets using MetaQC. The quality indices were measured by iteratively selecting the four datasets from the six AD blood (A) and eleven CVD blood (B) gene expression datasets. The heights (y-axis) of each bar plot represents the mean values of each quality index. For example, the quality indices of GSE60993 were measured 120 times (10C3). The mean values of the 120 measures for each quality index were calculated. Stars denote the first ranking dataset, which means the dataset had the best quality for a specific quality index. AD, Alzheimer’s disease; CVD, cardiovascular disease; IQC, internal quality control; EQC, external quality control; CQCg, consistency quality control (gene); CQCp, consistency quality control (pathway); AQCg, accuracy quality control (gene); AQCp, accuracy quality control (pathway); SMR, standardized mean rank.

