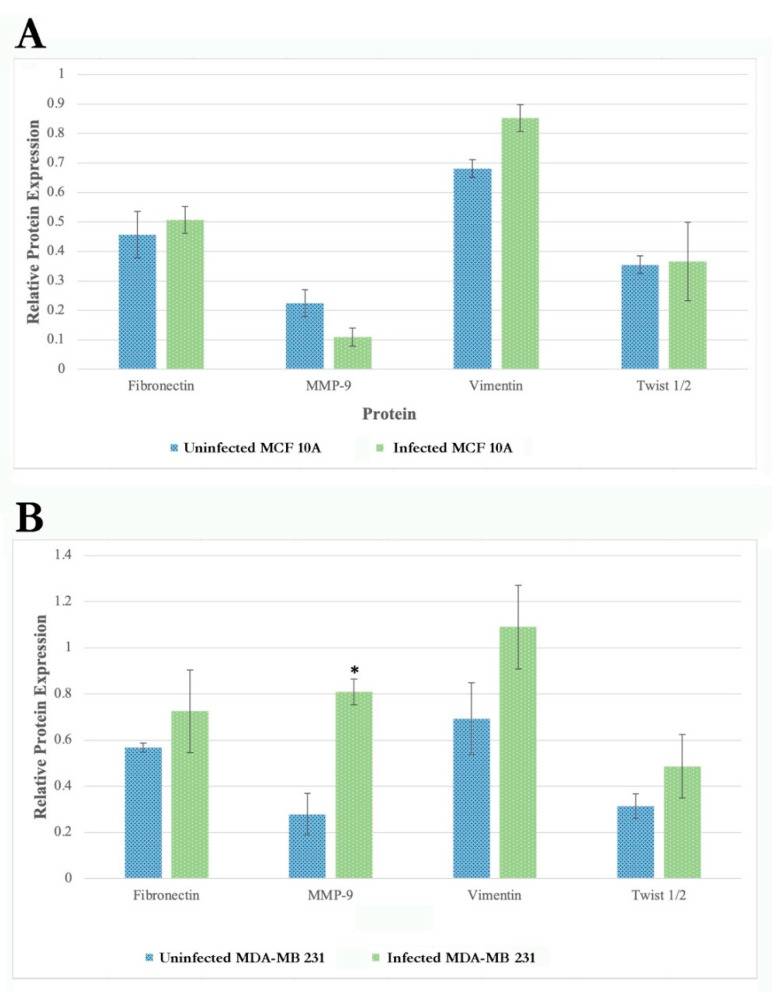
Figure 9.
Quantification and statistical analyses of three independent Western blot experiments for the expression levels of Fibronectin, Activated MMP-9, Vimentin, and Twist1/2, as described in Materials and Methods, in uninfected and 72 h infected MCF 10A (Panel A) and MDA-MB-231 cells (Panel B). Expression levels of the target proteins were normalized for the loading control GAPDH housekeeping protein. Statistical analyses were performed to find significant differences in protein expression level in infected cells compared to uninfected cells as described in Material and Methods. The error bars represent standard error of mean (SEM). The p-value of the data < 0.05 is considered significant and is indicated by *.

