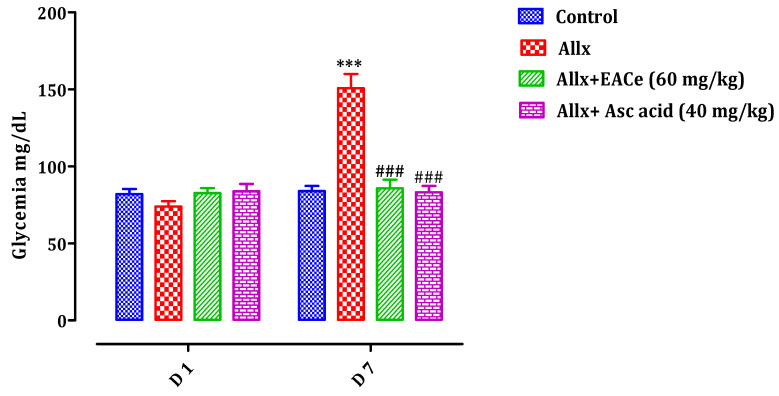
Figure 9.
Effect of oral administration of EACe and ascorbic acid on blood glucose level before (D1) and after (D7) alloxan intraperitoneal injection in mice. Values represent the mean ± SEM, (n = 7). *** p < 0.001 compared to the normal control group at the corresponding time. ### p < 0.001 compared to alloxan group at the corresponding time. (D1 = Day 1; D7 = Day 7).

