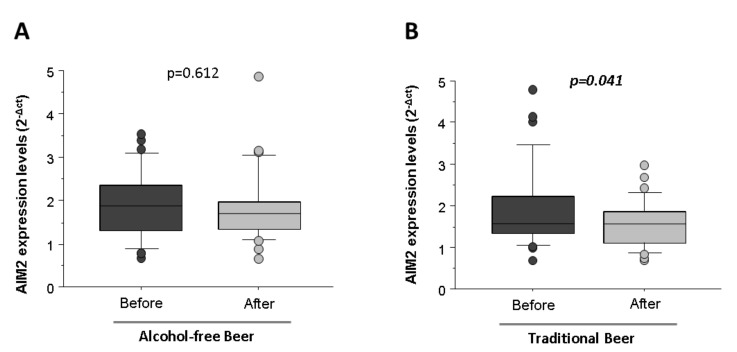
Figure 7.
Expression levels of AIM2 in macrophages exposed to LPS in the presence of serum from healthy volunteers obtained before and after regular and moderate consumption of (A) alcohol-free beer and (B) traditional beer for a period of four weeks. The results are expressed as median and quartile 1–3 (horizontal lines). RT-qPCR analyses were normalized with the endogenous PIK3C2A gene by calibration curve. The Student t-values for paired samples p < 0.05 are considered significant and refer to n = 36 individuals analyzed independently.

