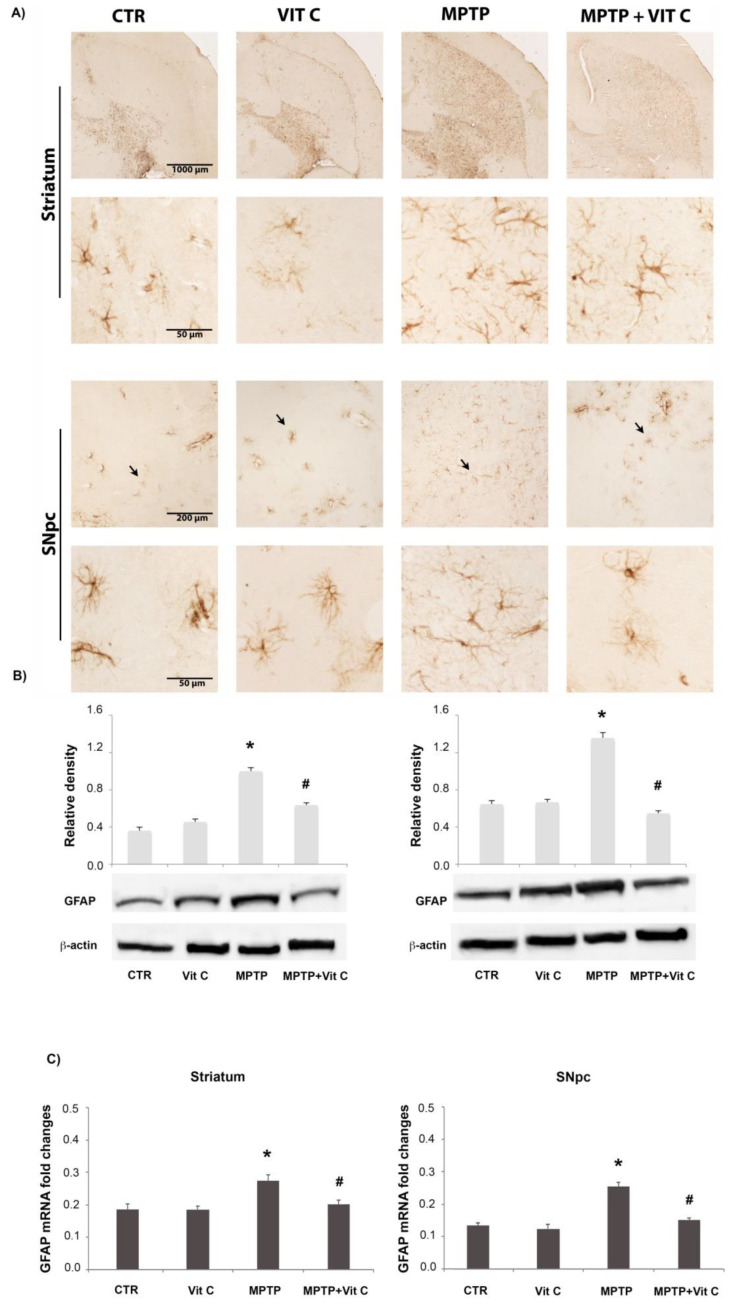
Figure 2.
GFAP analysis. (A) GFAP immunoreactive astrocytes in the striatum (upper) and SNpc (lower) of controls (CTR), mice treated with Vitamin C (VIT C), MPTP, MPTP, and Vitamin C (MPTP+ VIT C). Scale bar: (striatum) upper 1000 μm (obj. 4×), lower 50 μm (obj. 40×); (SNpc) upper 200 μm (obj. 4×), lower 50 μm (obj. 40×). In low magnification images, arrows point to GFAP immunoreactive cells shown in high magnification ones. (B) Western blotting detection and densitometric analysis of GFAP expression levels in controls (CTR), mice treated with Vitamin C (VIT C), MPTP, MPTP, and Vitamin C (MPTP+ VIT C) in striatum (left) and SNpc (right). Protein expression analysis values are expressed as arbitrary units after normalization against β-actin, used as a loading control (n = 5 in each group, 5 replicates). (C) Real-time PCR analysis of GFAP mRNA expression levels in controls (CTR), mice treated with Vitamin C (VIT C), MPTP, MPTP, and Vitamin C (MPTP+ VIT C) in striatum (left) and SNpc (right). Results are presented as mRNA fold changes relative to GAPDH, used as resident control. Data are presented as mean ± SD (* p < 0.05 vs. CTR; # p < 0.05 vs. MPTP). Supplementary Figure S2 shows the full western blots of Figure 2.

