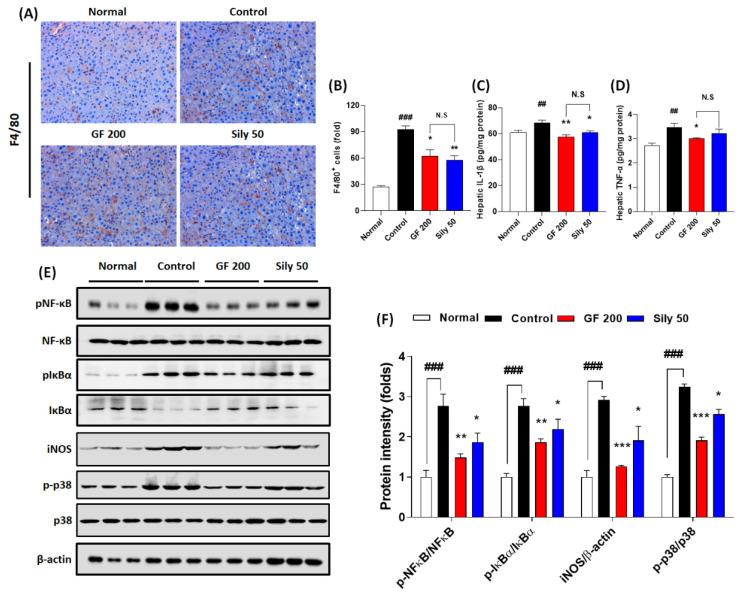
Figure 3.
Effects of GF on TAA-injected hepatic inflammation. (A) IHC analysis against F4/80 and (B) quantification analysis. (C) Hepatic protein levels of IL-1β and (D) TNF-α. (E) Western blot analysis of inflammatory related proteins including p-NF-κB, NF-κB, p-IκBα, IκBα, iNOS, p-p38, and p38 and (F) protein intensity. Data were expressed mean ± SEM (n = 4 for each group in IHC analysis; n = 9 for each group for IL-1β and TNF-α; n = 3 for each group in Western blot analysis). N.S, not significant, ## p < 0.01 and ### p < 0.001 for Normal vs. Control; * p < 0.05, **p < 0.01, and *** p < 0.001 for Control vs. GF 200 or Sily 50. H&E staining images were captured by light microscope condition (400-× magnifications).

