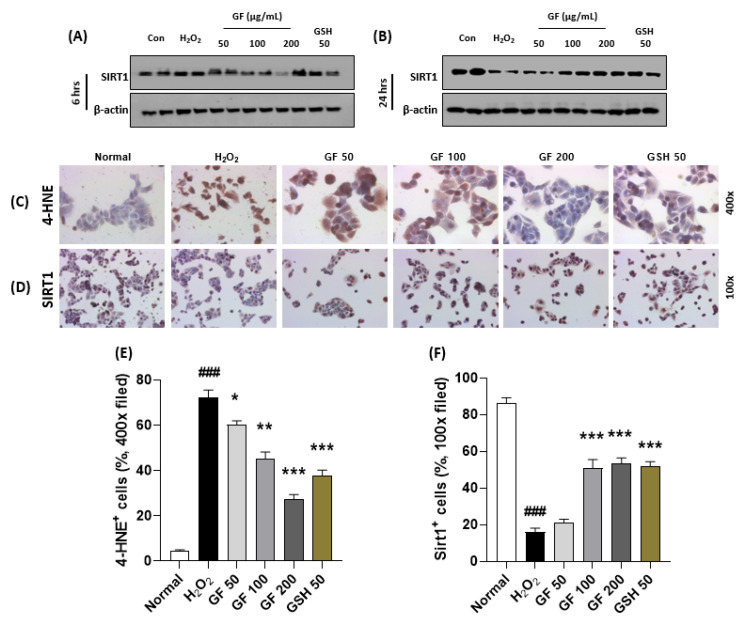
Figure 6.
GF attenuates hepatocyte oxidative stress via prevention from SIRT1 depletions. Western blot analysis in H2O2 (500 µM) treated HepG2 cells for 6 h or 24 h with or without GF (50, 100, 200 µg/mL). Cellular protein levels of SIRT1 for 6 h (A) and 24 h (B). IHC analysis against 4-HNE (C) and SIRT1 (D). Quantification analysis of 4-HNE (E) and SIRT1 (F). Data were expressed mean ± SEM (n = 4 for IHC analysis). ### p < 0.001 for Normal vs. H2O2 and * p < 0.05, ** p < 0.01, and *** p < 0.001 for H2O2 vs. GF or GSH. IHC images were captured by microscope condition (100- or 400-× magnifications).

