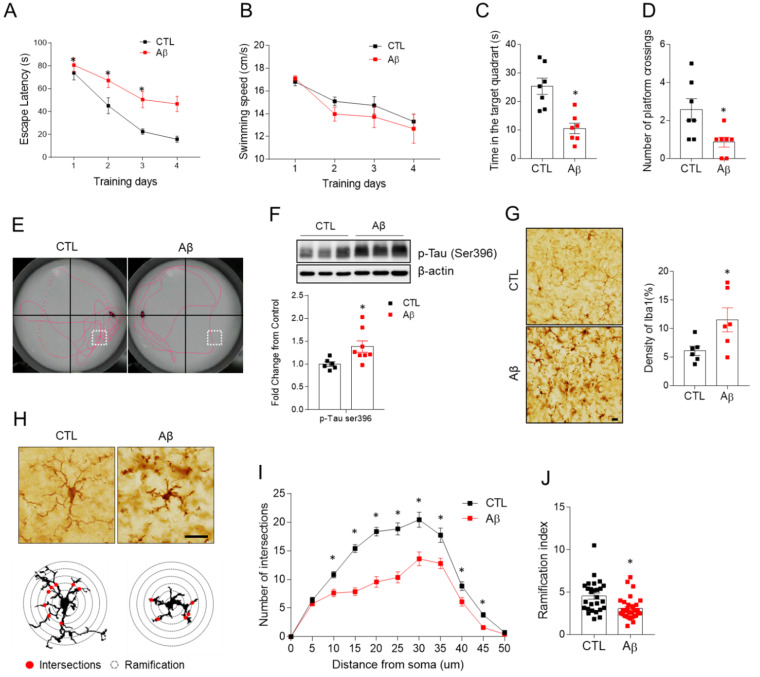
Figure 2.
Effects of AβO toxicity on memory deficits, hippocampal tau phosphorylation and microglia activation. The Morris water maze test in control and Aβ-treated mice at 34 weeks. (A) Escape latency and (B) average time spent in swimming speed over 4 days. (C) Time spent in the target quadrant, and (D) number of crossings over the platform area for the three time slices analyzed. (E) Representative swimming paths during the probe trail. (F) Western blot and quantified hippocampal phosphorylated tau (s396) expression. To normalize total protein level, β-actin was used as a loading control. (G) Representative images of Iba-1 immunohistochemistry and quantification of relative optical density (ROD) measurements (%) in hippocampal CA1 regions. Bar = 10 µm (H). The schemes graphically illustrate Sholl analysis of microglia morphology detects. (Red circles indicate Sholl intersections. Circle lines indicate Sholl sphere radius). (I) Average number of intersections at specified distances from the soma in microglia, and (J) Shoenen ramification index; 27 to 31 cells per region of n = 4 mice. Data are mean ± SEM. * p < 0.05 for control compared with Aβ-treated mice.

