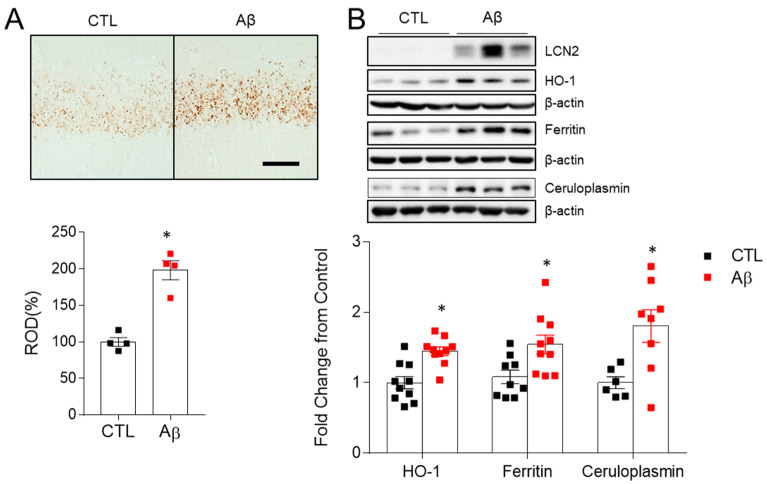
Figure 6.
Effects of AβO toxicity on iron accumulation and oxidative stress in the hippocampus. (A) Histological staining (×100) for iron with DAB-enhanced Perls’ staining in the hippocampal CA1 regions and relative optical density (ROD) measurements (%). Scale bar = 25 µm. (B) Western blots and quantified hippocampal HO-1, Ferritin, and Ceruloplasmin expressions. β-actin was used as a loading control. As shown in Figure 5A, AβO-induced LCN2 is also enhanced in same Western blot used in HO-1. The data are presented as mean ± SEM. * p < 0.05 for control compared with AβO-treated mice.

