Figure 8.
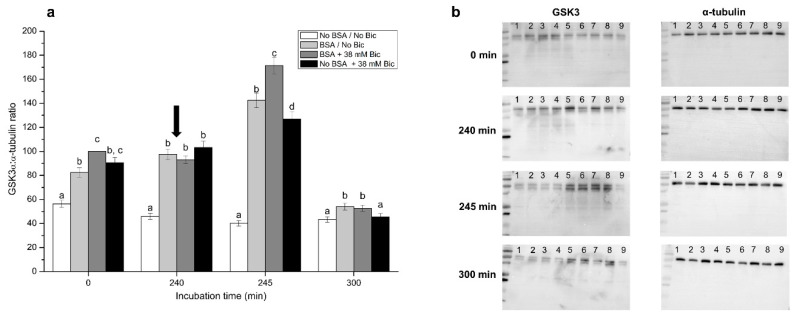
(a) Ratios between tyrosine-phosphorylated GSK3α and α-tubulin following incubation with different concentrations of bicarbonate (Bic; 0 mM, 38 mM) and BSA (0, 5 mg/mL) for 300 min. The black arrow indicates the time at which 10 μg/mL of progesterone was added (i.e., 240 min) to induce acrosome exocytosis. Different superscripts (a–d) indicate significant differences (p < 0.05) between treatments within the same time point. Data were corrected to a basal arbitrary value of 100 for the control point, which corresponded to the incubation in the medium containing BSA and 38 mM bicarbonate at 0 min. Results are shown as mean ± SEM for 12 independent experiments. (b) Representative blots for tyrosine-phosphorylated GSK3 and α-tubulin. Lane 1: No BSA/No Bic; Lane 2: BSA + 38 mM Bic; Lane 3: No BSA + 38 mM Bic; Lane 4: BSA/No Bic; Lane 5: No BSA + 5 mM Bic; Lane 6: BSA + 5 mM Bic; Lane 7: No BSA + 15 mM Bic; Lane 8: BSA + 15 mM Bic; Lane 9: No BSA/No Bic.

