Figure 3.
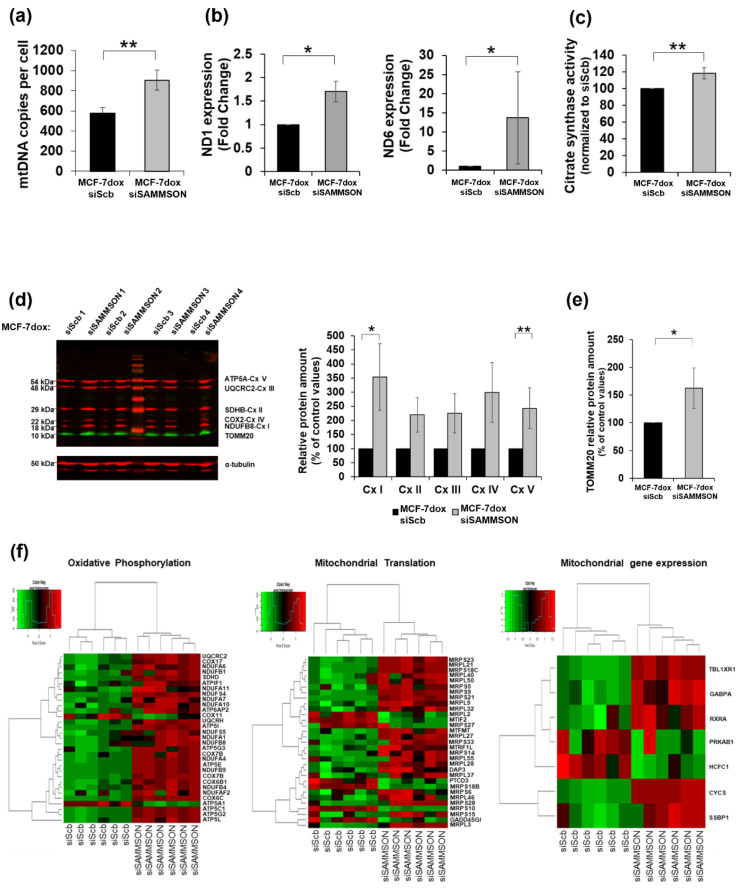
Impact of SAMMSON silencing in mitochondrial replication, transcription and translation in MCF-7dox cells. (a) Quantification of the mitochondrial DNA (mtDNA) in the MCF-7dox siScb and siSAMMSON cells. The ratio of the mtDNA/nuclear DNA was analyzed using qPCR. The data are represented by the mean ± SEM mtDNA copies per cell of n = 5 MCF-7dox siScb and siSAMMSON cells. (b) Quantification of the mitochondrial RNA ND1 and ND6 in the MCF-7dox siScb and siSAMMSON cells via RT-qPCR. Data are represented by the mean ± SEM of n = 4 MCF-7dox siScb and siSAMMSON cells. (c) Citrate synthase activity was measured in duplicate on crude cell lysates and normalized to the total amount of proteins. The data are represented by the mean ± SEM of n = 8 MCF-7dox siScb and siSAMMSON cells. (d) Western blot of OXPHOS mitochondrial complexes performed on MCF-7dox siScb and siSAMMSON cell lysates. An antibody cocktail was used to examine the expression of five mitochondrial proteins. Left panel: representative blot; right panel: quantification of respiratory chain complexes (Cx I, Cx II, Cx III, Cx IV and Cx V) normalized to α-tubulin protein quantity. Data are represented by the mean ± SEM of n = 6 for MCF-7dox siScb and siSAMMSON cells. (e) Quantification of the mitochondrial marker TOMM20 normalized to α-tubulin. (f) Heatmap of differentially expressed genes in mitochondrial pathways in MCF-7dox siScb and siSAMMSON treated cells. For panels (a–e), p-values were calculated using the Mann–Whitney test, with * p < 0.05 and ** p < 0.01.

