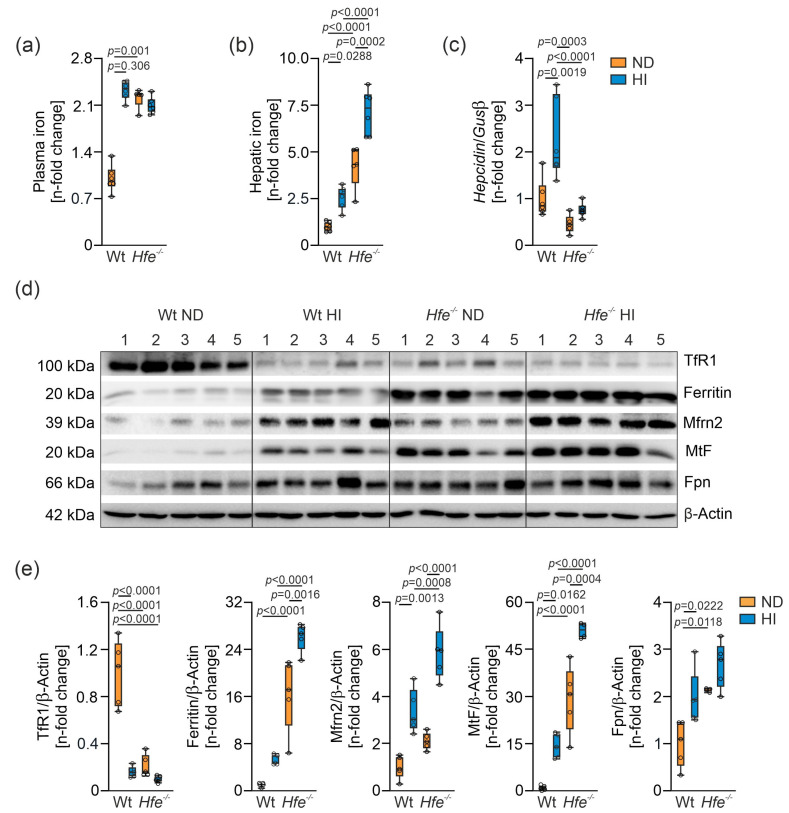
Figure 1.
Impact of dietary and genetic iron overload in wildtype (Wt) and Hfe−/− mice on systemic and hepatic iron homeostasis. Wt and Hfe−/− mice were fed normal diet (ND) or high iron diet (HI) for two weeks. (a) Plasma iron concentration; (b) hepatic iron content; (c) hepatic hepcidin mRNA expression; (d) Western blots of proteins involved in cellular and mitochondrial iron metabolism (transferrin receptor 1 (TfR1), ferritin, mitoferrin 2 (Mfrn2), mitochondrial ferritin (MtF), ferroportin (Fpn)) along with (e) densitometric quantification of Western blots. β-Actin served as loading control. All results were obtained from snap-frozen samples. n = 5–6 mice per group. Values are depicted as n-fold change of Wt ND. Kruskal–Wallis test: (a) p = 0.0014; two-way ANOVA: (b) diet, F(1,19) = 36.00, p < 0.0001; genotype, F(1,19) = 108.8, p < 0.0001; diet X genotype, F(1,19) = 3.062, p = 0.0963; (c) diet, F(1,19) = 13.74, p = 0.0015; genotype, F(1,19) = 23.60, p = 0.0001; diet X genotype, F(1,19) = 5.067, p = 0.0364; (e) TfR1—diet, F(1,16) = 48.86, p < 0.0001; genotype, F(1,16) = 39.44, p < 0.0001; diet X genotype, F(1,16) = 28.76, p < 0.0001; Ferritin—diet, F(1,16) = 21.44, p = 0.0003; genotype, F(1,16) = 147.3, p < 0.0001; diet X genotype, F(1,16) = 3.433, p = 0.0825; Mfrn2—diet, F(1,16) = 72.74, p < 0.0001; genotype, F(1,16) = 25.05, p = 0.0001; diet X genotype, F(1,16) = 3.673, p = 0.0733; MtF—diet, F(1,15) = 39.71, p < 0.0001; genotype, F(1,15) = 137.2, p < 0.0001; diet X genotype, F(1,15) = 2.387, p = 0.1432; Fpn—diet, F(1,15) = 12.19, p = 0.0033; genotype, F(1,15) = 17.98, p = 0.0007; diet X genotype, F(1,15) = 1.091, p = 0.3129. Values are shown as median ± interquartile range. The exact p-values are indicated in the graphs.

