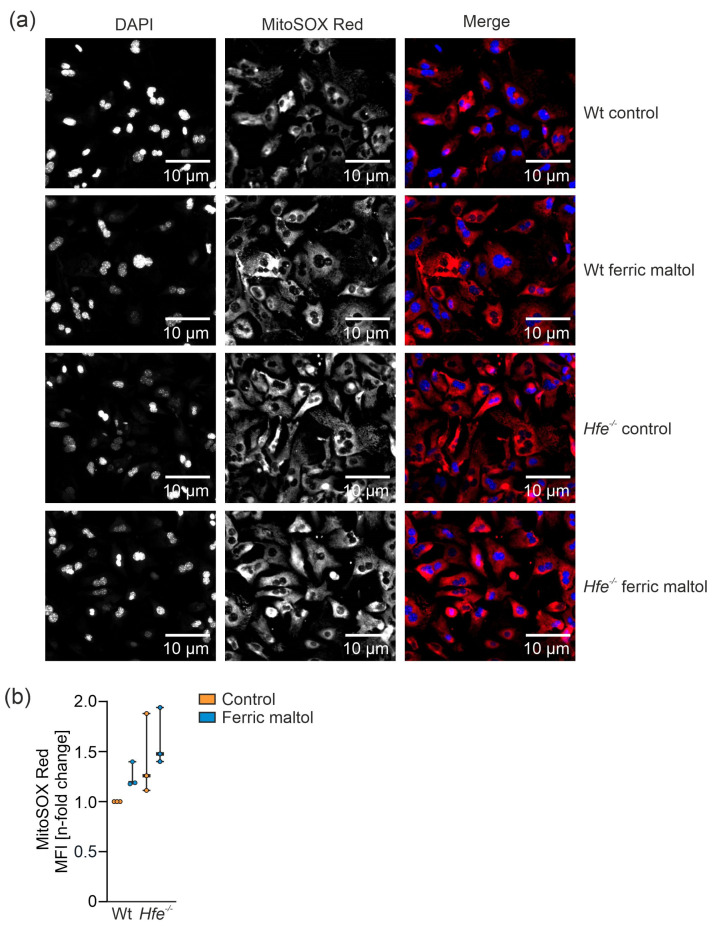
Figure 8.
Determination of mitochondrial superoxide formation in primary murine hepatocytes from Wt and Hfe−/− mice in the presence or absence of the iron source ferric maltol (100 µM for 48 h). (a) Immunofluorescence images of primary murine hepatocytes isolated from Wt and Hfe−/− mice treated with 100 µM ferric maltol for 48 h were stained with MitoSOX (red; mitochondrial superoxide) and DAPI (blue; nuclei). Scale bar = 10 µm. (b) Flow cytometry analysis of mitochondrial superoxide formation in primary murine hepatocytes; the graph summarizes three independent experiments performed in triplicates (n = 3 mice per group, n = 3 replicates). MFI: mean fluorescence intensity. Two-way ANOVA: (b) Ferric maltol, F(1,8) = 2.227, p = 0.1740; genotype, F(1,8) = 6.608, p = 0.0331; ferric maltol X genotype, F(1,8) = 0.04869, p = 0.8309. Values are shown as median ± interquartile range.

