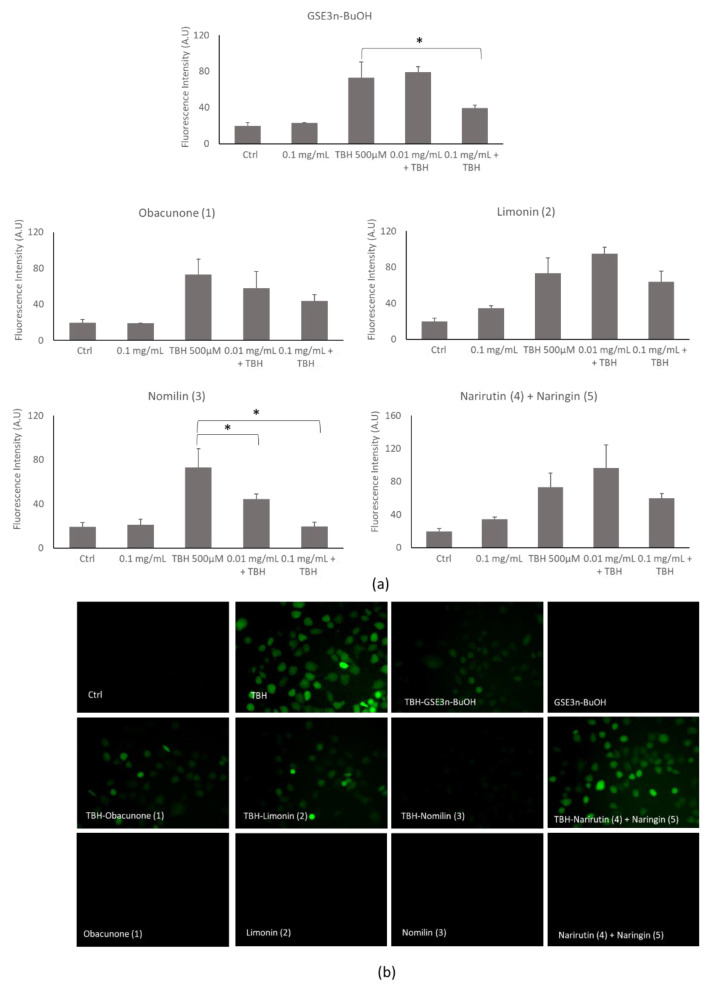
Figure 7.
Reactive oxygen species analysis of grapefruit seeds’ butanol extract (GSE3n-BuOH) and isolated compounds (obacunone (1), limonin (2), nomilin (3), narirutin (4) + naringin (5)). (a) Histogram of ROS generation of untreated cells (Ctrl) or cells treated with 500 µM of TBH alone or in cotreatment with extracts at increasing concentrations for 2 h. (b) Representative cells’ fluorescence images of untreated cells (Ctrl) or cells treated with TBH or cotreated with TBH and grapefruit seed extracts at 0.1 mg/mL and treated with the extracts at 0.1 mg/mL each. * p < 0.05 compared to treated (TBH) group.

