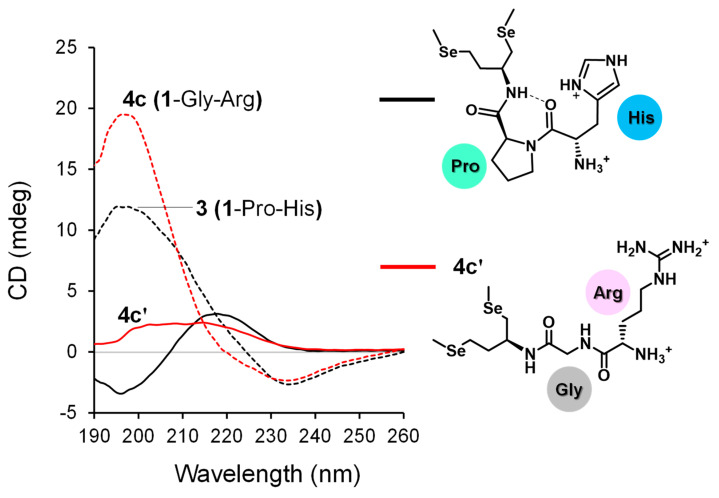
Figure 5.
CD spectra of compounds (200 μM) in 10 mM Tris-HCl buffer solution containing 1 mM EDTA at pH 7.5 and 25 °C. The spectra were determined using a quartz cell (path length = 1 mm). Data of 3 (black dashed line) and its open-chain form (black solid line) were reported previously [28].

