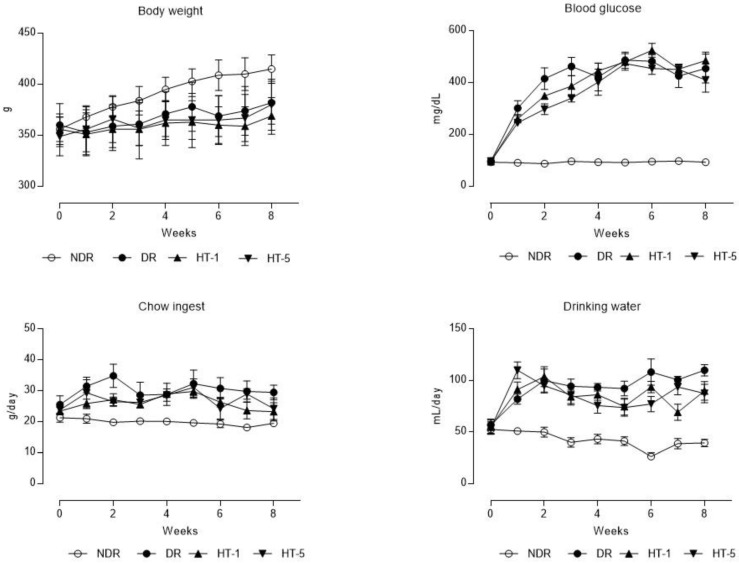
Figure 1.
Time-course curves of the evolution of body weight, blood glucose, mean daily chow ingestion, and drinking water (mean ± standard error of the mean) in control nondiabetic rats (NDR), control diabetic rats (DR), and DR treated with hydroxytyrosol 1 mg/kg/day p.o. (HT-1) or 5 mg/kg/day p.o. (HT-5). N = 10 rats per group.

