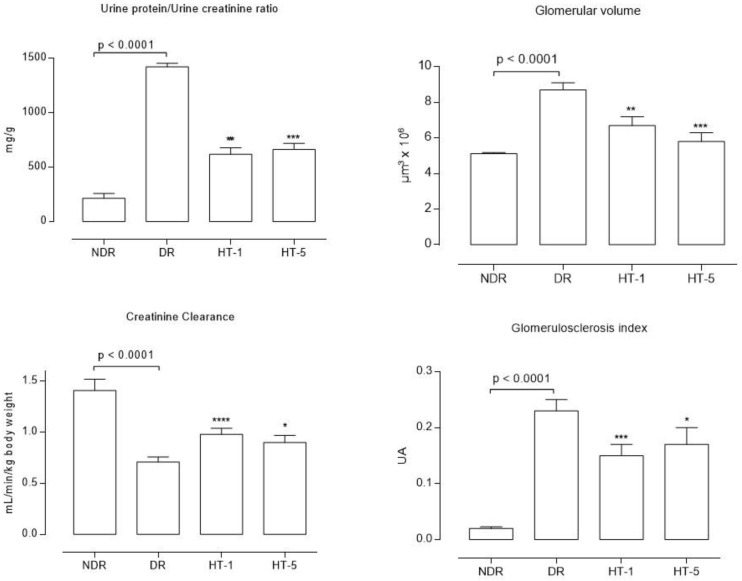
Figure 2.
Mean values (mean ± standard error of the mean) of the proteinuria/urine creatinine ratio, calculated creatinine clearance, glomerular volume, and glomerulosclerosis index after eight weeks of follow up in control nondiabetic rats (NDR), control diabetic rats (DR), and DR treated with hydroxytyrosol 1 mg/kg/day p.o. (HT-1) or 5 mg/kg/day p.o. (HT-5). N = 10 rats per group. * p = 0.04, ** p = 0.001, *** p = 0.004, **** p < 0.0001, with respect to DR.

