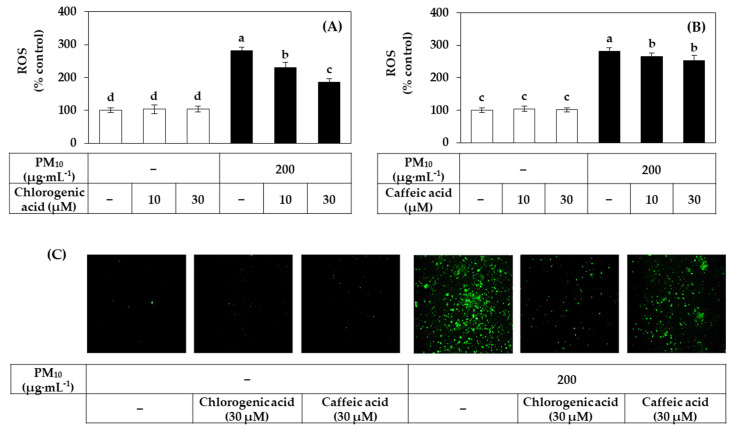
Figure 11.
Effects of chlorogenic acid versus caffeic acid on the ROS production in HaCaT keratinocytes exposed to PM10. Cells were labeled with DCFH-DA, treated with SHE at different concentrations, and exposed to PM10 (200 μg mL−1) for 60 min or not. Typical images of cells fluorescing due to the oxidation of DCFH-DA by ROS are shown in (C). The fluorescence of the cell extracts was measured to determine ROS levels (A,B). Data are presented as mean ± SD (n = 4). Duncan’s multiple range test was performed to compare all group means to each other. Groups that share the same letters (a–d) do not have significantly different means at the p < 0.05 level.

