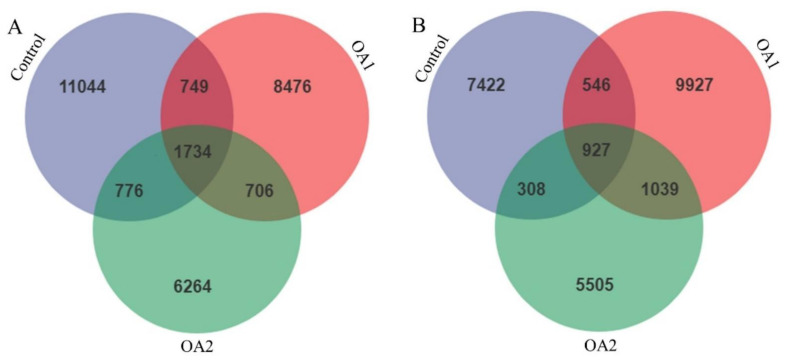
Figure 3.
Number of identified ASVs in various comparisons in cecum chyme at day 14 (A) and day 49 (B). Each ellipse represents a treatment; the numbers in the diagrams represent how many ASVs are unique in the three groups and how many are shared as the areas intersect. ASVs, amplicon sequence variants.

