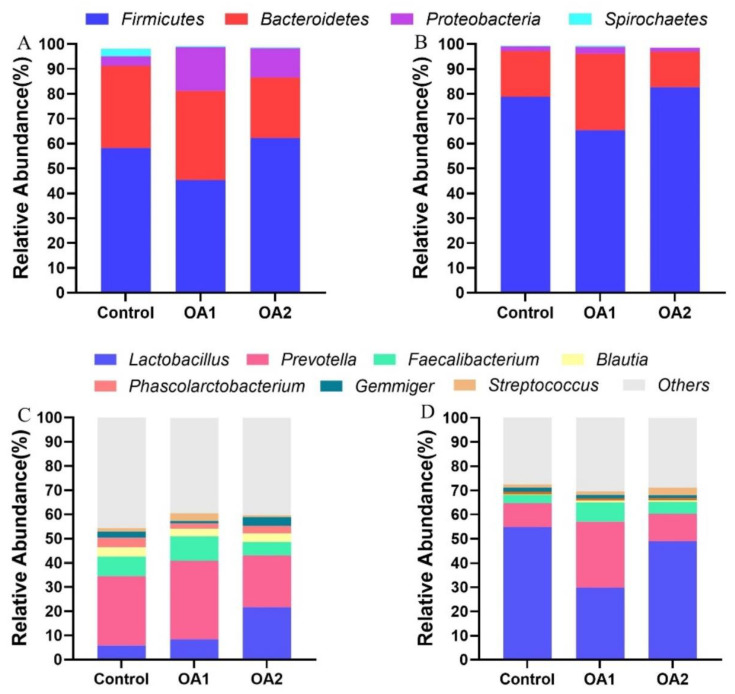
Figure 4.
The analysis of composition of bacteria in cecum chyme. The phylum level of composition of bacteria at day 14 (A) and day 49 (B). The genus level of composition of bacteria at day 14 (C) and day 49 (D). The color-coded bar plot shows the relative abundance of bacterial phyla across the different groups.

