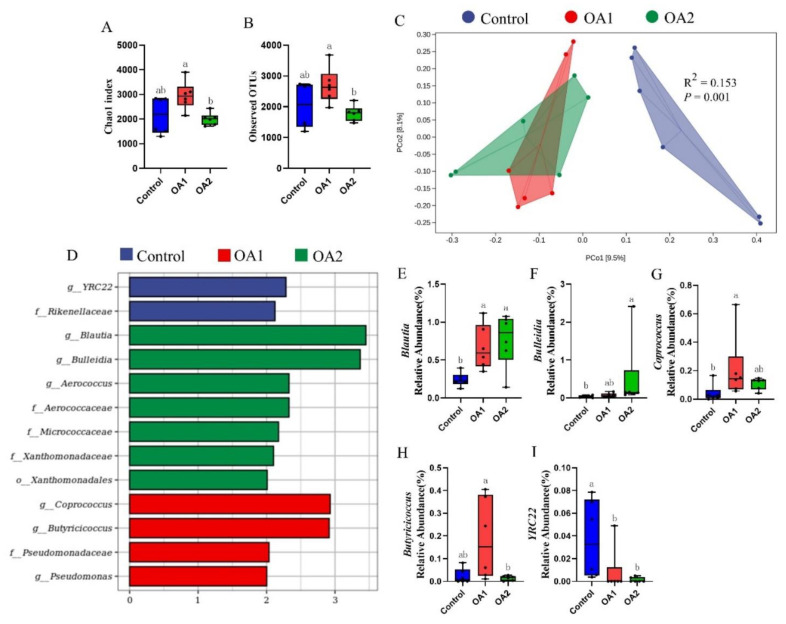
Figure 6.
Gut microbiota analysis of cecum chyme at day 49. Comparison of alpha diversity index (Chao1 index and observed OTUs) among three groups (A,B). Principal coordinates analysis (PCoA) based on Jaccard distances (C). Each point in the figure represents a sample, and different colored points indicate different groups. p-values were tested by permutational multivariate analysis of variance (Adonis). LEfSe analysis effect size identified the most differentially abundant taxa in the cecal chyme microbiota community of the three groups, and only taxonomies of LDA score >2 are shown (D). Relative abundances of Blautia, Bulleidia, Coprococcus, Butyricicoccus, and YRC22 among the three groups (E–I). Labeled means with different superscript letters are significantly different (p ≤ 0.05) by Wilcoxon’s rank-sum test (n = 6). LDA, linear discriminant analysis.

