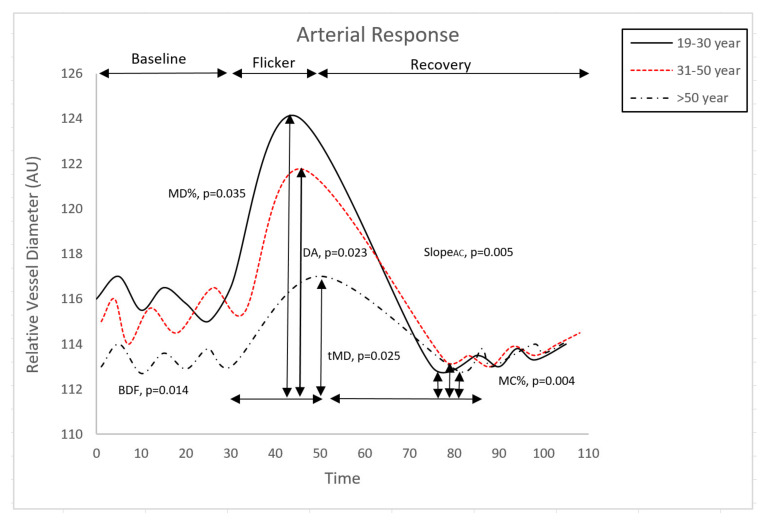
Figure 3.
Comparison of retinal arterial response profile across groups. Abbreviations: AU, arbitrary units; BDF, baseline diameter fluctuation calculated as the maximum range in vessel diameter during first 30 s of baseline readings; MD%, percent dilation calculated as the percentage change in vessel diameter from baseline to maximum following onset of flicker; tMD, time to reach maximum diameter during flicker; slopeAC, slope of arterial constriction calculated as (MC-MD)/(tMC); DA, dilation amplitude (difference between MD and MC during flicker); MC%, percent constriction calculated as the percentage change in vessel diameter from baseline to maximum following end of flicker.

