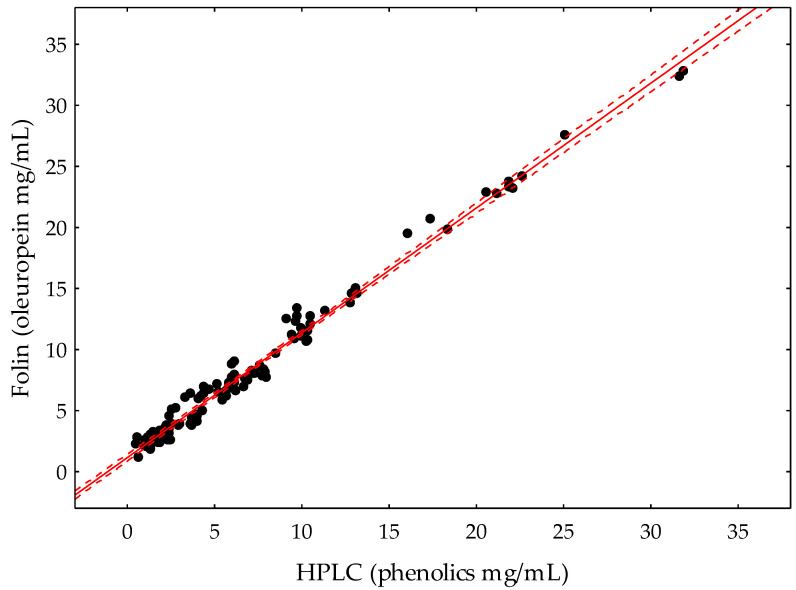
Figure 3.
Comparison of phenolic contents in olive fruit samples analyzed by the new Folin–Ciocalteau-based method expressed as oleuropein and by HPLC, expressed as the sum of the main phenolics in the olive fruit described in Material and Methods. Dashed lines correspond to the 99% confidence interval for the regression line.

