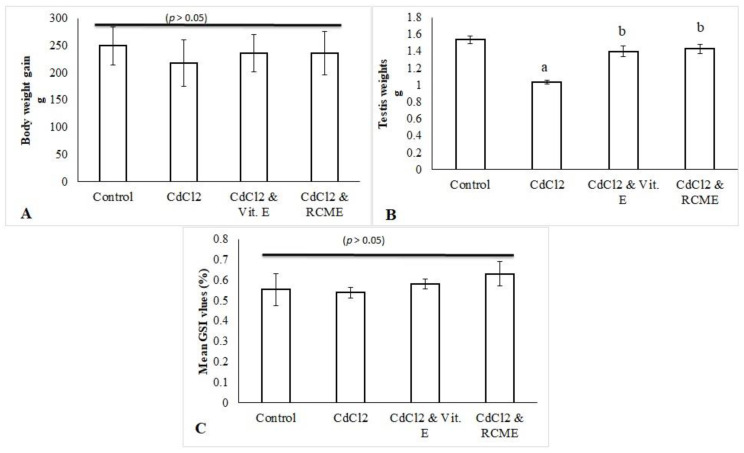
Figure 3.
Mean values in grams of body weight gain (A) and testes weights (B) as well as the mean values of GSI (C) in control and treated groups. Each bar represents the mean ± SEM. a. p < 0.05 versus normal control. b. p < 0.05 versus CdCl2 group. RCME: Red carrot methanolic extract; Vit. E: Vitamin E; GSI: gonadosomatic index.

