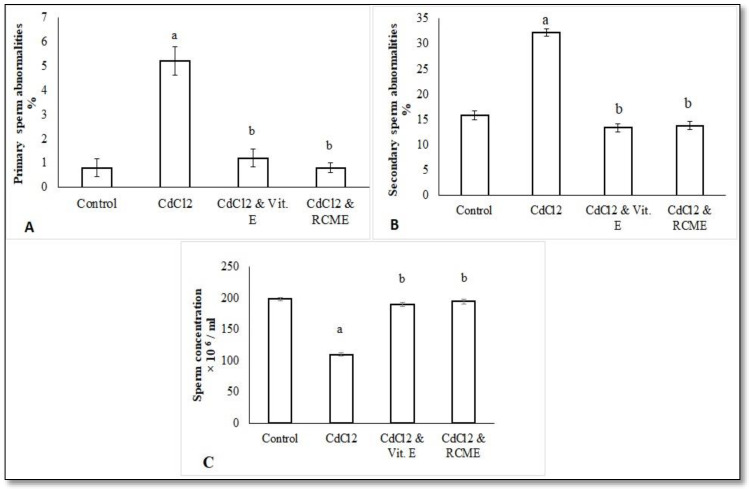
Figure 4.
Mean values of primary (A) and secondary (B) sperm abnormalities as well as sperm concentration (C) in epididymal semen samples of control and treated rats. Each bar represents the mean ± SEM. a, p < 0.05 versus normal control. b. p < 0.05 versus CdCl2 group. RCME: Red carrot methanolic extract.Vit. E: Vitamin E.

