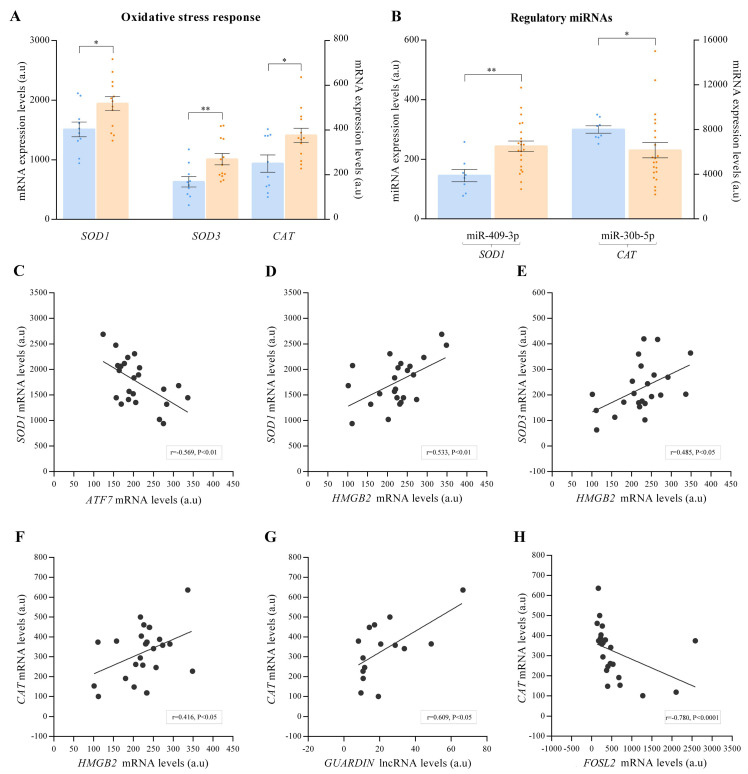
Figure 3.
Dot plot graph of mRNA (n = 23) and miRNA (n = 30) expression levels of altered molecules associated with stress oxidative response. (A) mRNA relative expression levels of altered genes associated with stress oxidative response. (B) miRNAs target SOD1 and CAT. (C) Correlation of ATF7 mRNA levels with SOD1 mRNA levels. (D) Correlation of HMGB2 mRNA levels with SOD1 mRNA levels. (E) Correlation of HMGB2 mRNA levels with SOD3 mRNA levels. (F) Correlation of HMGB2 mRNA levels with CAT mRNA levels. (G) Correlation of GUARDIN mRNA levels with CAT mRNA levels. (H) Correlation of FOSL2 mRNA levels with CAT mRNA levels. The results were obtained by mRNA-sequencing SOLiD 5500XL platform and ncRNA-sequencing Illumina HiSeq 2500 platform. Data are presented as the mean ± SEM. au, arbitrary units. Ischemic cardiomyopathy patients (orange), controls subjects (blue). * p < 0.05, ** p < 0.01.

