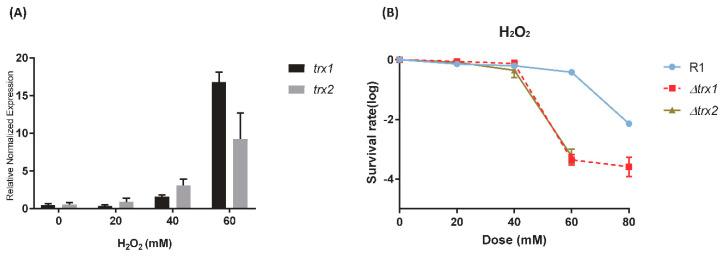
Figure 1.
Transcription and phenotype of Δdrtrx1 and Δdrtrx2 under H2O2 stress. (A) D. radiodurans was exposed to H2O2 at the indicated concentrations (0, 20, 40, 60 mM), and qRT-PCR analysis was performed to determine drtrx1 and drtrx2 transcription level. The fold increase of transcription was determined by setting the expression level of the non-treated control to 1. (B) Survival curves of D. radiodurans wild-type, Δdrtrx1, and Δdrtrx2 treated with different concentrations of H2O2 (0, 20, 40, 60, and 80 mM). The cells spotted on TGY plates and colonies were counted after 3 d. Error bars indicate the standard deviation for three experimental replicates.

