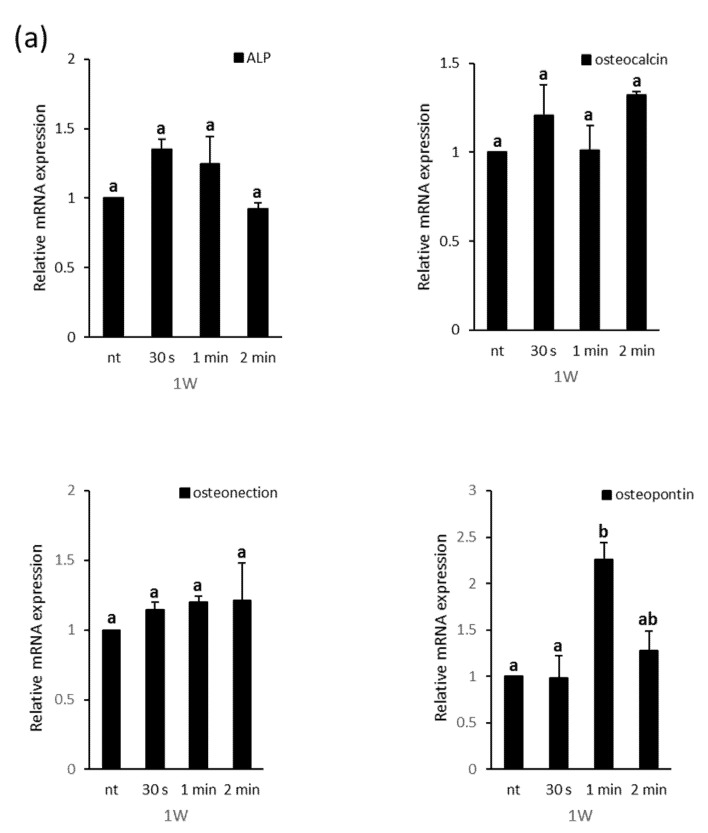
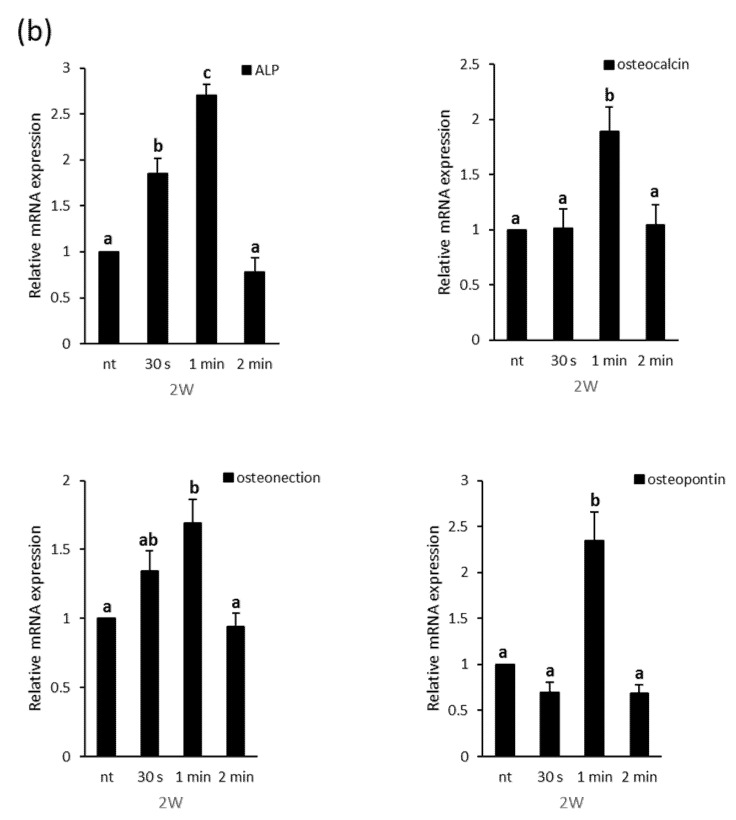
Figure 4.
Relative mRNA expression level of the 2−ΔΔCt values by real time PCR, including ALP, osteocalcin, osteonectin, and osteopotin, in PDL cells at (a) 1 and (b) 2 weeks of osteogenic induction. Different letters (a, b, c) indicate statistically significant differences by one-way ANOVA (p < 0.05).


