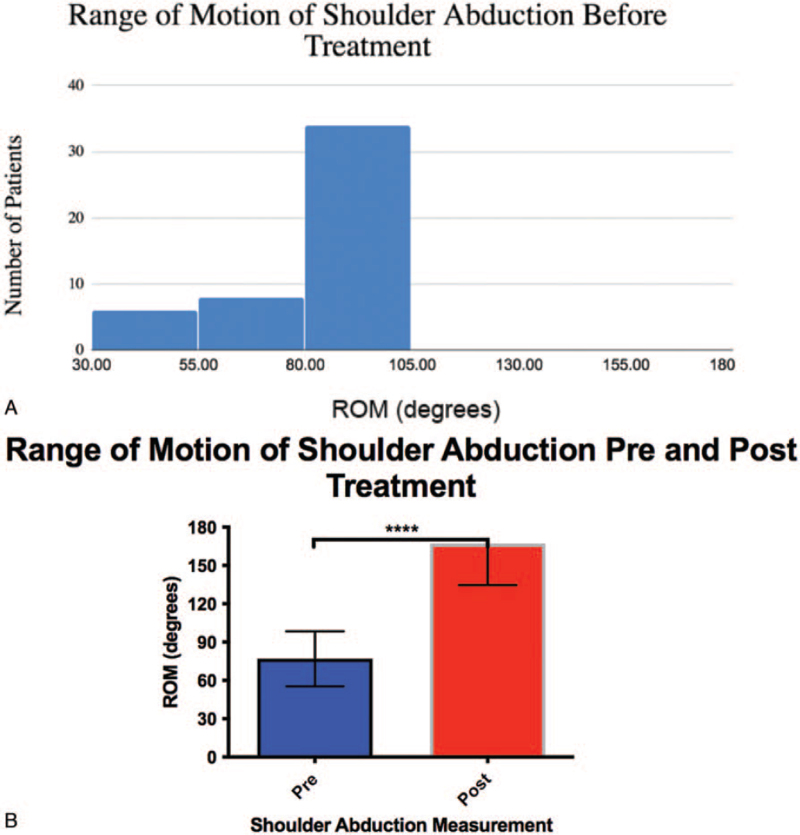
Figure 2.
ROM of shoulder abduction prior to and after injection. (A) The bar graph indicates the number of patients within specified ranges of motion for shoulder abduction before injection and active manipulation. The ROM for all patients was recorded to be from 30° to 100° for shoulder abduction. (B) The bar graph demonstrates the average ROM of shoulder abduction pre and postinjection and active manipulation. A statistically significant difference was observed with a Student t test. The error bars represent standard deviation. ROM = range of motion.

