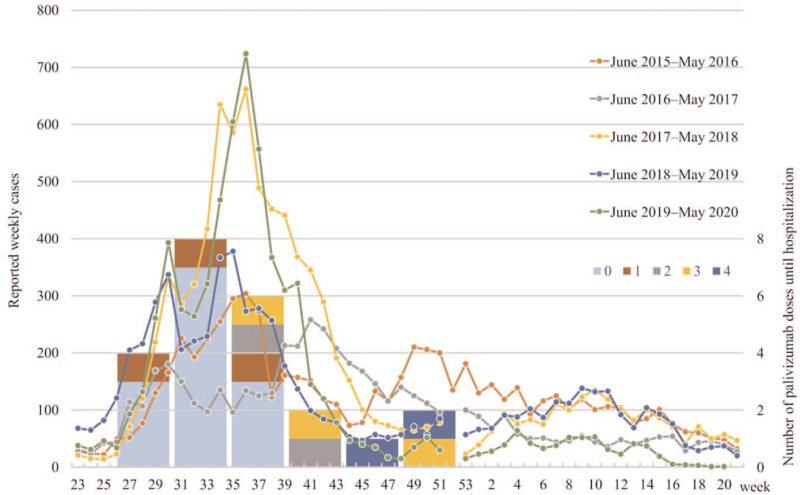
Figure 3.
The line graph shows the reported weekly cases of RSV infection from 2015 to 2019 in Fukuoka Prefecture, where the research facility is located (axis 1). The bar graph shows the number of patients with RSV who were admitted to the hospital during the month. The number of palivizumab doses (0-4) administered before admission is indicated by color coding (axis 2). RSV = respiratory syncytial virus.

