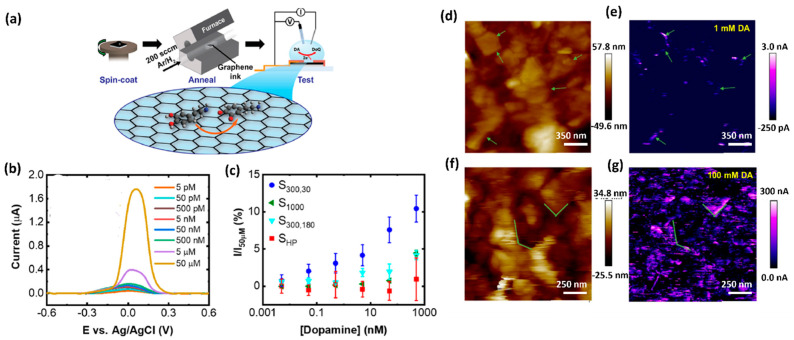
Figure 2.
(a) Schematic representation of fabrication and electrochemical testing process of the graphene ink-based DA sensor. (b) Differential pulse voltammogram of the response towards DA detection from 5 pM to 50 μM. (c) Normalized peak current values versus DA concentration. (d) Height map, measured using scanning electrochemical microscopy (SECM) and (e) the corresponding electrochemical map with 1 mMDA. (f) A height map of a different region of the graphene film and (g) the corresponding electrochemical map with 100 mM DA [22].

