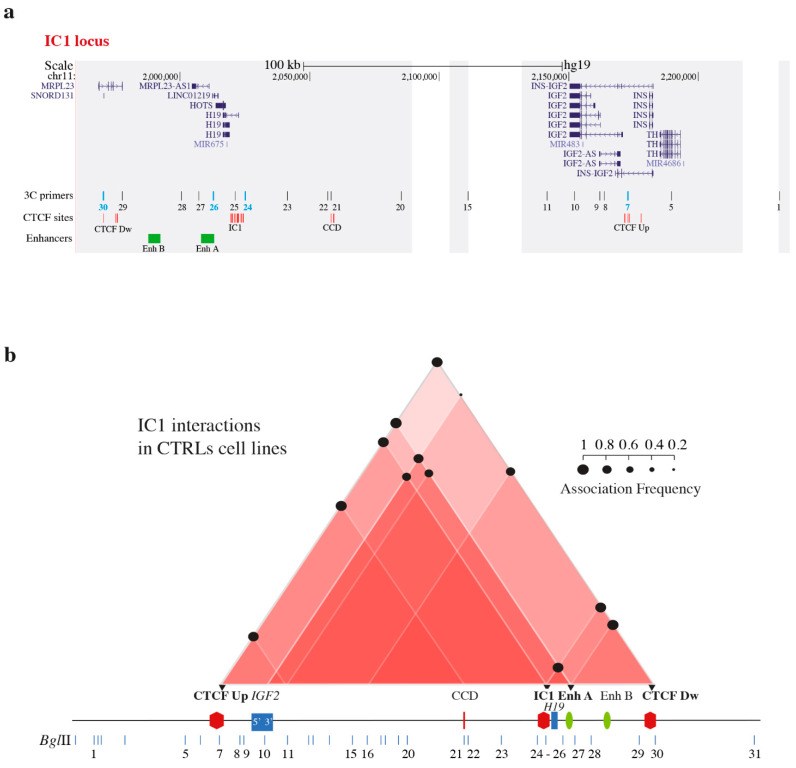
Figure 1.
3C and interactome analyses in control cell lines. (a) Scheme of the IC1 locus under analysis (UCSC Genome Browser map position 1,960,000 to 2,235,000). Areas covered by 3C analysis are highlighted in grey. The locations of genes are indicated in the upper part. Vertical black lines, corresponding to BglII restriction sites, indicate the primers used for 3C analysis. Anchor primers are highlighted in turquoise. Red and green lines indicate clusters of CTCF-binding sites in reverse or forward orientation, respectively. Green bars (EnhA and EnhB) correspond to enhancer regions. CTCF-binding sites: CTCF Up, CCD, IC1, and CTCF Dw. (b) Schematic representation of the IC1 domain interactome in control cell lines. The data for each cell line were derived from two independent 3C experiments. Interactions between different elements of the IC1 region are shown by red triangles; increasing color intensity corresponds to an increase in the number of interactions of the subregion. Mean association frequencies of CTRL1 and CTRL2 are indicated with black circles. Black triangles indicate the anchors used for 3C analysis. A linear representation of the domain is shown below. In accordance with the transcription of genes in the region, panel b was drawn in reverse orientation with respect to the map in panel a. Adapted from [31] following the Creative Commons Attribution 4.0 International License.

