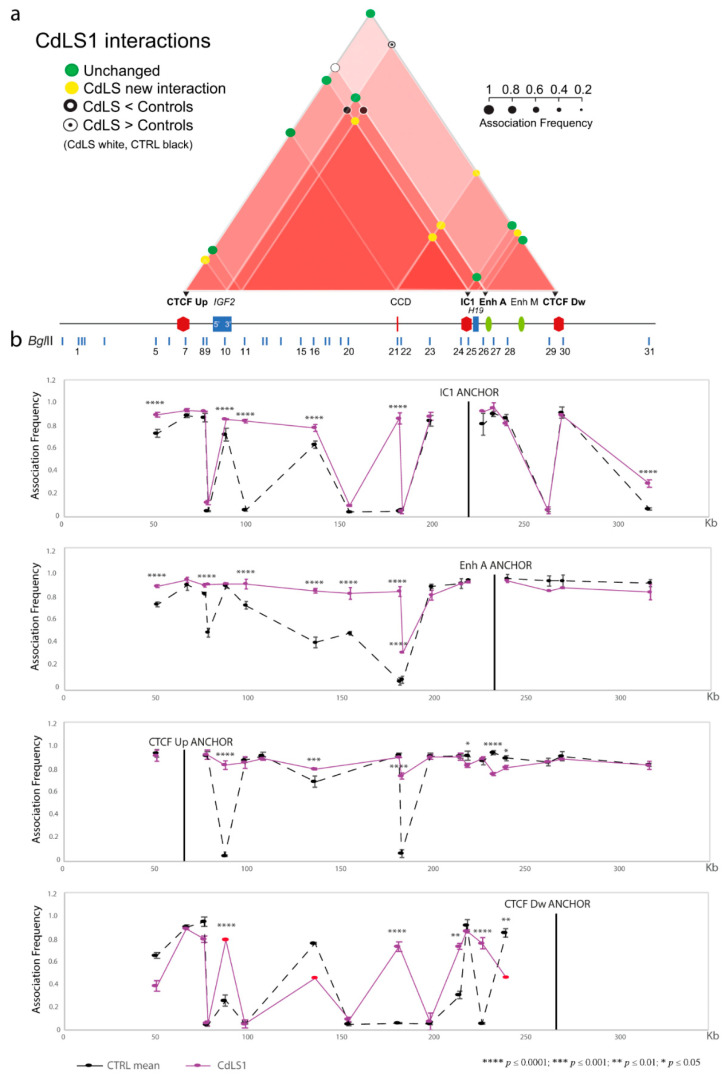
Figure 2.
Abnormalities in chromatin architecture at the IC1 locus of the CdLS1 cell line (SMC1A mutation). The figure is to scale. (a) Scheme of the statistically significant modifications in the chromatin interactome of the IC1 domain in the CdLS1 cell line compared with the mean of the controls. Interactions between different elements of the IC1 region are shown by red triangles; increasing color intensity corresponds to an increase in the number of interactions of the sub-region. Colored circles represent association frequencies as described in the figure. Black triangles indicate the anchors used for 3C analysis. A linear representation of the IC1 imprinted domain is depicted below the interactome. (b) IC1 locus looping profiles for the indicated anchors in controls (dotted black) and CdLS1 (pink) cell lines. BglII restriction sites are indicated above. Each point in the profile is the mean ± standard deviation of two independent 3C experiments and indicates the association frequency between the anchor and the fragment on the left of the corresponding BglII restriction site. Differences (two-way ANOVA test) are indicated by asterisks. Red dots indicate the points with standard deviation > 0.1.

