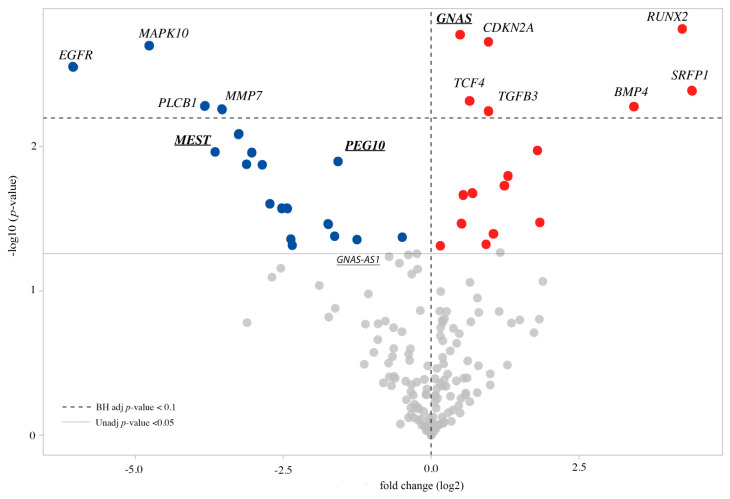
Figure 5.
Volcano plot of DEGs CdLS compared to control cell lines. Upregulated genes are highlighted by red dots, while downregulated genes by blue dots. In bold and underlined are reported the DE imprinted genes. FDR < 0.1 (Benjamini–Hochberg adjusted p value) and unadjusted p value < 0.05 are indicated by horizontal lines. The VolcaNoser tool was used for creating volcano plots [51].

