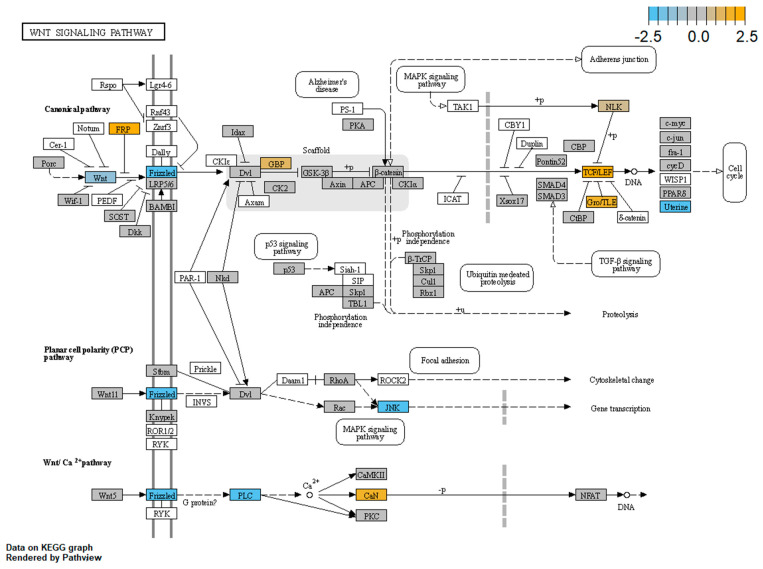
Figure 7.
Schematic representation of DEGs in the CdLS cell lines belonging to the three main WNT pathways (figure rendered by Pathview, nSolver Advanced Analysis Software 4.0). Pathway nodes shown in white have no genes in the Vantage 3DTM RNA WNT Pathways Panel. Pathway nodes in grey have corresponding genes in the panel, however no significant differential expression is observed. Nodes in blue and orange denote downregulation or upregulation in CdLSs compared to CTRLs. Node Frizzled, DEGs: FZD3, FZD5, FZD8 and FZD10; node Wnt, DEG: WNT10B; node FRP, DEG: SFRP1; node GBP, DEG: FRAT1; node TCF/LEF, DEGs: TCF4, LEF1 and TCF7L1; node Gro/TLE, DEG: TLE1; node Uterine, DEG: MMP7; node JNK, DEG: MAPK10; node PLC, DEG: PLCB1; node CaN, DEGs: PPP3CA and PPP3CC.

