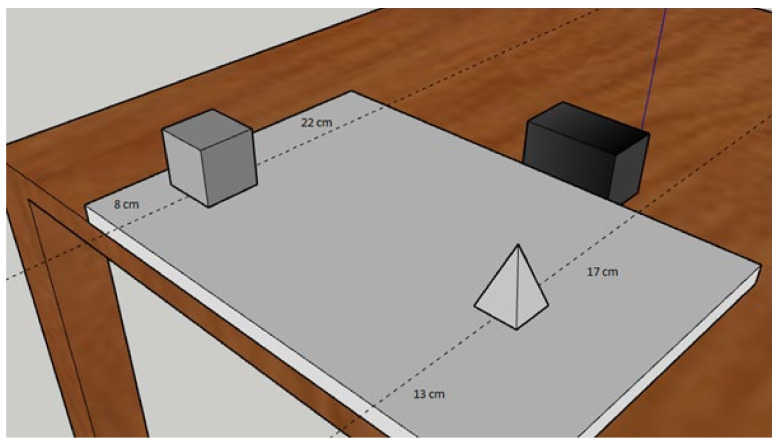
Figure 2.
This image is only intended to show how the difficulties were calculated within each trial. As can be seen, the metric difficulty with respect to the participant’s position (shown in the image by the edge of the table) was 5 cm (the cube was positioned at 8 cm from the participant and the pyramid at 13 cm), the same level of metric difficulty results with respect to the black bar (22−17 = 5 cm).

