Figure 3.
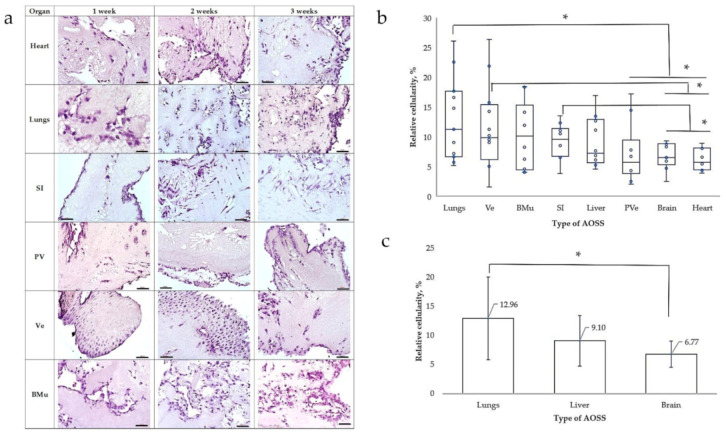
(a) Structural evolution of the organ-specific TECs that combine human MDA-MB-231 cells and CE AOSSs, as observed histologically during 3 weeks of in vitro culture. All of the TECs demonstrate initial colonization of the surface areas with cancer cells, followed by progressive invasion into the deeper parts of the scaffolds with increasing total cellularity. Note the organ-specific colonization patterns such as cells’ growth in association with the luminal ECM elements, such as the former walls of blood vessels in the heart and BMu, and colonization of parabronchial ECM in the lung TECs; linear pattern (“Indian-files”) of tumor invasion along the former muscular layers in SI ECM and the tunica muscularis in Ve; and the templated colonization of the former glandular elements and secretory lining of PV and Ve. Staining with Hematoxylin and Eosin. Scale bars, 50 µm (brains, hearts, lungs, SI, and BMu) and 100 µm (PV and Ve). (b) Relative cellularity of the TECs combining MDA-MB-231 cells and AOSS obtained from the different organs of origin on the 7th day of in vitro culture. Blue circles indicate the individual values, the blue horizontal lines show the mean, the boxes represent the range between the 25th and 75th percentiles, and the whiskers reflect the minimal and maximal observed values. Statistically significant differences (* p < 0.05) between the studied TECs are shown by black lines. (c) Relative cellularity (mean ± standard deviation) of the MDA-MB-231/AOSS TECs representing the common cites of the distant organ metastases of breast cancer. Statistically significant difference (* p < 0.05) between the lung and brain TECs is shown by a black line. Abbreviations: SI—small intestine; PV—proventriculus; Ve—ventriculus; BMu—breast muscle.

