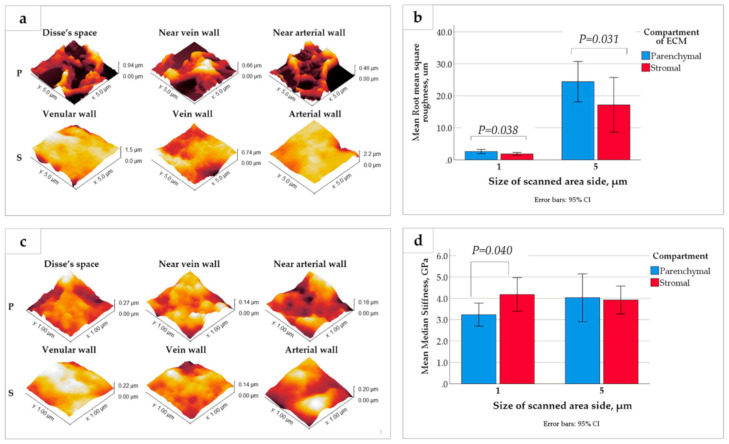
Figure 5.
(a,c) Topography AFM images of the (a) micron scale, 5 × 5 µm, and the (c) submicron, 1 × 1 µm, areas of the dehydrated CE liver ECMs of parenchymal (P) and stromal (S) origin. (b,d) Quantitative analysis of the surface roughness (b) and stiffness (d) of dehydrated LS-ECM compartments. Notably, the graph in (b) shows that the LS-ECM compartments differ by root square roughness at both the micron and submicron scales (explored in 5 × 5 µm and 1 × 1 µm images, respectively) with statistical significance. At the same time, as shown in (d), the LS-ECM compartments differ by median stiffness with a statistical significance only at the submicron scale (as explored in 1 × 1 µm images).

