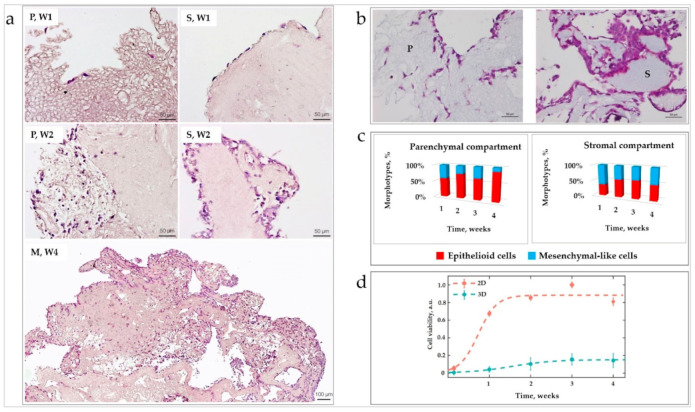
Figure 6.
(a) Representative histological images of cellular colonization of the liver AOSSs during four weeks of in vitro culture (time points are labeled as W1, W2, and W4 for the first, second, and fourth weeks, respectively). The images of parenchymal and stromal compartments are labeled as “P” and “S,” respectively. “M” labels the remodeled ECM with mixed parenchymal and stromal features. Staining with H&E, the scale bars are 50 µm (top and middle rows) and 100 µm (bottom row). The top row shows the colonization patterns on the 5th day in vitro. Note sparse individual cells that are attached to the loose spongy-like parenchymal ECM on the outer border of the TEC (on the left). In contrast, formation of a discontinuous lining is visible on the dense ECM of the stromal compartment (on the right). Middle row, Day 13 in vitro: Note the colonization of the parenchymal compartment (P, W2) (the fragment with loose structure near the surface of AOSSs) by individual cells and predominantly single-cell invasion to the stromal ECM. A few small multicellular clusters showing predominant single-cell invasion in the deeper parts of the scaffold are visible on the border with the area composed by the stromal ECM. In parallel, in the stromal ECM compartment (S, W2): The continuous multi-row cell lining on the stromal ECM with minimal invasion is observable. Bottom row (M, W4): Remodeling of the ECM of stromal origin and massive diffuse colonization of the whole scaffold (day 28). (b) Parenchymal (P) and stromal (S) compartments of the CE liver ECM—TNBC 3D TECs on week 2. Staining by Masson’s trichrome method. Note similar tinctorial properties (light blue staining indicating comparable concentrations of collagen) and different distribution of the cells (stained purple) over the compartments. There are lower cell numbers and deeper invasion of individual cells in the parenchymal sector and formation of dense cellular clusters near the surfaces (with shallow invasion depth of cell collectives) in the stromal compartment. Scale bars, 50 μm. (c) Effect of parenchymal and stromal LS-ECM on cell morphology. Distribution of the epithelioid and mesenchymal-like cellular morphotypes in LS-ECM compartments during four weeks of in vitro culture in TECs. (d) Cell growth dynamics of MDA-MB-231 cells in 2D and 3D (TEC) in vitro cultures. Dashed curves represent the lines of best fit given by Equation (1).

