Figure 7.
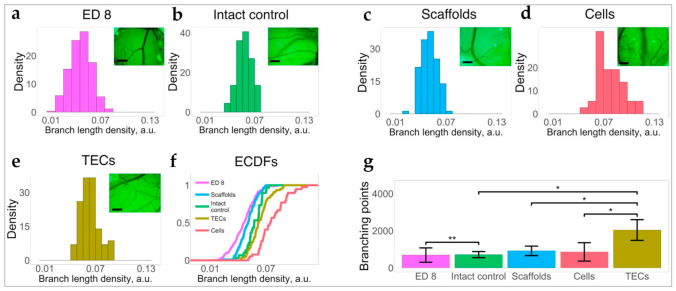
The angiogenic effects of 3D TECs, liver AOSSs (scaffolds), and suspensions of MDA-MB-231 cells (cells), grafted on a chick embryo CAMs compared to natural growth of CAM vasculature (intact control) in the period between ED8 and ED12 of the embryonic development. Histograms of branch length density of (a) CAM vasculature on the day of grafting (ED8), and in (b) intact control CAMs (ED12), (c) scaffolds, (d) cells, and (e) TECs. The insets are images of blood vessels located in the vicinity of grafted materials. Scale bars, 2 mm. (f) ECDFs of branch length density in CAMs on ED8 and in each group on ED12. (g) Comparison of the number of branching points (per unit area) in CAM blood vessels in the studied groups. Error bars indicate standard deviation. Stars denote the level of statistical significance by Mann–Whitney test: * p < 0.05 and ** p < 0.01.

