Figure 8.
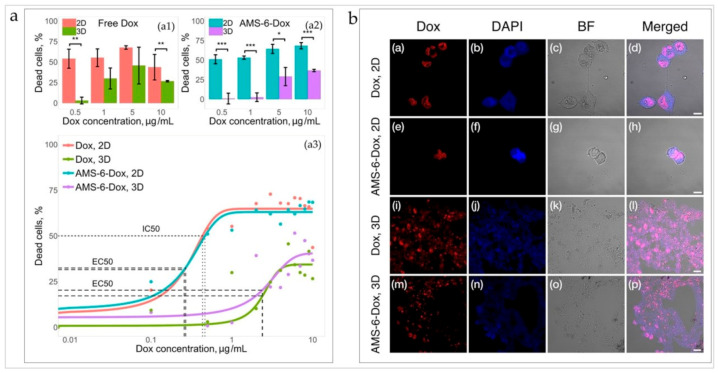
(a) Cytotoxicity of free and nanoformulated Dox in 2D cultures of MDA-MB-231 cells and 3D TECs. The top graphs: The effect of free Dox (on the left) and the effect of AMS-6-Dox (right graph). Error bars indicate CI95%; statistically significant difference at * p < 0.05, ** p < 0.01, *** p < 0.001 by Mann–Whitney U-test. Bottom graph: Dose–response curves of free Dox and AMS-6-Dox in 2D and 3D in vitro cultures. Solid lines represent the lines of best fit given by Equation (3) (see Table A6 and Table A7 in Appendix A.3.5.2 for fit parameters). Note that in the 3D culture, the IC50 could not be calculated within the studied concentration range (up to 10 µg/mL). (b) Confocal microscopy images of MDA-MB-231 cells incubated for 24 h with (the upper row) Dox in 2D; (the second row) AMS-6-Dox in 2D; (the third row) Dox in 3D; and (the fourth row) AMS-6-Dox in 3D TECs. Intrinsic Dox fluorescence was detected in the red channel (Dox), while DAPI fluorescence (blue channel, DAPI) was used for contrasting of cell nuclei. Control bright field (BF) images were acquired to visualize the tissue structures, and merged images highlight the colocalization of Dox and DAPI signals. Dox concentration, 10 μg/mL. Scale bars, 10 μm (Dox, 2D; AMS-6-Dox, 2D) and 20 μm (Dox, 3D; AMS-6-Dox, 3D). The experiments were repeated twice, with at least triplicates for each condition. The illumination conditions were kept constant for every imaging channel.

